FINANCIAL HIGHLIGHTS 2007
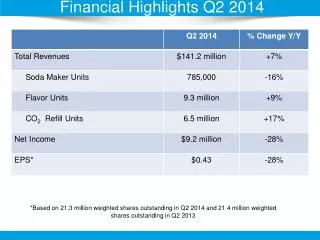
In 2007, SIBUR achieved a remarkable 17% growth in sales compared to the previous year. This increase was driven by higher sales volumes across nearly all product groups and favorable pricing due to strong market demand. Operating profit and net profit reached record highs despite challenges such as rising raw material costs, higher tariffs, and inflationary labor pressures impacting margins. Effective management through optimization programs significantly mitigated these negative factors. Operating cash flow nearly doubled, reflecting robust operational efficiency. ###


FINANCIAL HIGHLIGHTS 2007
E N D
Presentation Transcript
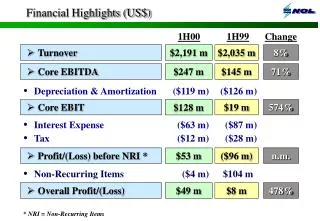
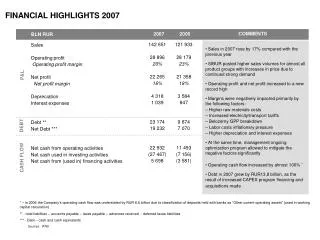
FINANCIAL HIGHLIGHTS 2007 COMMENTS 2007 2006 BLN RUR 142651 28 896 20% 22 265 16% 4 318 1 039 23 174 19 232 22 932 (27 467) 5 698 121 933 28 179 23% 21 358 18% 3 584 847 9 874 7 070 11 493 (7 156) (3 581) Sales Operating profit Operating profit margin Net profit Net profit margin Depreciation Interest expenses Debt ** Net Debt *** Net cash from operating activities Net cash used in investing activities Net cash from (used in) financing activities • Sales in 2007 rose by 17% compared with the previous year • SIBUR posted higher sales volumes for almost all product groups with increases in price due to continued strong demand • Operating profit and net profit increased to a new record high • Margins were negatively impacted primarily by the following factors: • Higher raw materials costs • Increased electricity/transport tariffs • Belozerny GPP breakdown • Labor costs inflationary pressure • Higher depreciation and interest expenses • At the same time, management ongoing optimization program allowed to mitigate the negative factors significantly • Operating cash flow increased by almost 100% * • Debt in 2007 grew by RUR13,8 billion, as the result of increased CAPEX program financing and acquisitions made P&L DEBT CASHFLOW * – in 2006 the Company’s operating cash flow was understated by RUR 6,6 billion due to classification of deposits held with banks as “Other current operating assets” (used in working capital calculation) ** - total liabilities – accounts payable – taxes payable – advances received - deferred taxes liabilities *** - Debt – cash and cash equivalents Sources: IFRS