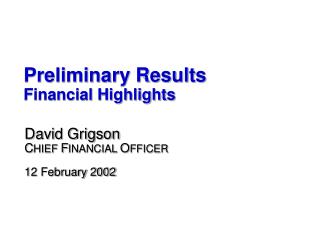
Financial Highlights (US$)
Financial Highlights (US$) 1H00 1H99 Change Turnover $2,035 m 8% $2,191 m Core EBITDA $145 m 71% $247 m Depreciation & Amortization ($119 m) ($126 m) Core EBIT $19 m 574% $128 m Interest Expense ($63 m) ($87 m) Tax ($12 m) ($28 m) Profit/(Loss) before NRI * ($96 m) n.m.

Financial Highlights (US$)
E N D
Presentation Transcript
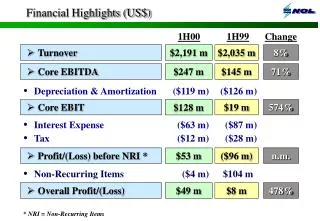
Financial Highlights (US$) 1H00 1H99 Change • Turnover $2,035 m 8% $2,191 m • Core EBITDA $145 m 71% $247 m • Depreciation & Amortization ($119 m) ($126 m) • Core EBIT $19 m 574% $128 m • Interest Expense ($63 m) ($87 m) • Tax ($12 m) ($28 m) • Profit/(Loss) before NRI * ($96 m) n.m. $53 m • Non-Recurring Items ($4 m) $104 m • Overall Profit/(Loss) $8 m 478% $49 m * NRI = Non-Recurring Items
Chartering 7% Logistics 9% Other Investments 2% 1H99 Revenue Breakdown : (Total = US$2.03b) Container Shipping: 72% Logistics : 8% Chartering : 6% Other Investments* : 14% Container Shipping 82% * includes revenue from APL Stacktrain business which was divested in May 1999 Turnover Breakdown Total Revenue : US$2.19 billion, up 8% Excluding stacktrain, up 22%
Container Volume 1H00 Volume (675,000 FEUs) • Americas 319,000 • Europe 139,000 • Asia / Middle East 217,000 1H99 Volume (583,000 FEUs) • Americas 285,000 • Europe 134,500 • Asia / Middle East 163,500 Overall change : up by 16%
Container Shipping - Trade Imbalance For every 10 feus Full Headhaul Full Backhaul Trade 1H98 1H99 1H00 • Trans-Pacific 4 5 6 • Asia/Europe/Asia 5 8 8 • Transatlantic 4 7 9 • Latin America 3 5 7
Container Shipping - Average Freight Rates 1H99 FY99 1H00 Average freight rates US$2,386 US$2,450 US$2,441 • Average freight rates include all trades • Peak season surcharges for Transpacific in the second half of 1999 positively impacted the full year average for 1999
Container Shipping - Cost Trend Analysis for Cost (Indexed)
Logistics - Revenue Growth Growth : 22%
1-YEAR TIME-CHARTER RATES 170 Aframax Tanker Panamax Bulk Carrier 150 Rate Index 130 110 90 70 Jul-99 Jan-99 Jan-00 Sep-99 Mar-99 Mar-00 Nov-99 May-99 May-00 Source : Tradewinds • Improved Aframax tanker rates from Jan 2000 • Overall improvement in bulk carrier rates, but Group’s exposure in this sector is small Chartering - Rates
1H99 Container Logistics Chartering Others* Total Turnover $1,458 m $167 m $123 m $287 m $2,035 m Core EBIT ($9 m) $12 m $7 m $9 m $19 m Container Logistics Chartering Others Total Turnover $1,808 m $203 m $145 m $35 m $2,191m Core EBIT $97 m $14 m $13 m $4 m $128 m 1H00 Segmental Results in US$ (1H00 vs 1H99) * includes revenue/ earnings from APL Stacktrain business which was divested in May 1999
1H00 • Loss on sale of vessels ($5m) • Profit on sale of other assets $5m • Provision for quoted investment ($4m) Total non-recurring items ($4m) TOTAL NON- RECURRING ITEMS FOR 1H99 $104m Non-Recurring Items (US$)