Download
1 / 43
430 likes | 501 Vues
Explore how familiarity with response labels affects participant responses on Likert scales and implications for multilingual surveys. Investigate intensity hypothesis versus familiarity hypothesis.

E N D
The Effect of Familiarity with the Response Category Labels on Item Response to Likert Scales Bert Weijters Maggie Geuens Hans Baumgartner
Motivating Example a French researcher wants to replicate an empirical finding that was established in the U.S. using data based on consumer self-reports in France; in the English questionnaire, a Likert scale with endpoints of ‘strongly disagree’ and ‘strongly agree’ was used; should the French researcher use ‘fortementd’accord’ or ‘tout à fait d’accord’?
Research questions Do the labels attached to the response scale categories influence response behavior (i.e., how many respondents endorse the extreme scale categories)? What causes this effect? How can the effect be mitigated? What are the implications for multilingual and monolingual surveys?
Research questions (cont’d) various characteristics of rating scales have been studied, but the problem of choosing appropriate labels for the response categories has been largely ignored; this is surprising because category labels typically apply to many if not all of the items in a questionnaire; if differences in responding to survey items as a function of the category labels have been acknowledged, the effect has generally been attributed to the perceived intensity of the labels (intensity hypothesis); in this research we propose the familiarity hypothesis (i.e., scale categories marked by labels that are used more often in day-to-day language are more likely to be endorsed) and contrast it with the intensity hypothesis;
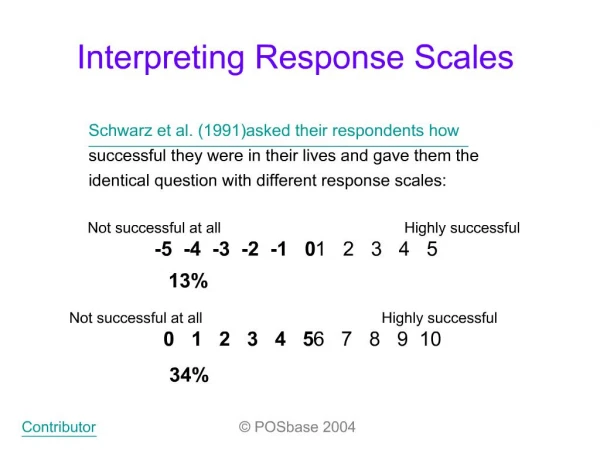
Literature review • certain aspects of the labels attached to the response categories on rating scales can have systematic effects on people’s responses to questionnaires: • the range of response alternatives provided can influence respondents’ answers to questions (Schwarz et al. 1988); • the response alternatives provided (e.g., feeling really irritated “several times a day” to “less than twice a week” vs. “more than once every 3 months” to “less than once a year”) may affect the interpretation of the question (Schwarz et al. 1988); • use of different numeric values (-5 to +5 vs. 0 to 10) can change the meaning of endpoint labels such as “not at all successful” (Schwarz et al. 1991); • can endpoint labels in Likert scales that differ in terms of the amplifier used (e.g., “strongly” vs. “completely” (dis)agree) change responses?
Inferences based on therange of response alternatives provided • Schwarz et al. (1985) • question about hours spent watching TV
The intensity hypothesis intensity is defined as the degree or extent of the attribute expressed by the label (e.g., degree of agreement or disagreement, extent of liking); prior research shows that scale anchors in general (e.g., adjectives for evaluating products, such as “good”, “terrific”, or “superior”, as in Wildt and Mazis 1978) and amplifiers used in Likert scales (e.g., “slightly”, “somewhat” or “very much” agree, as in Spector 1976) differ in perceived intensity; more intense labels represent more extreme positions, which should be endorsed less often (e.g., agree vs. strongly agree; superior vs. very good);
The intensity hypothesis (cont’d) Wyatt and Meyers (1987) found that when the extremes of the response scale were anchored by narrower or less absolute labels (i.e., “agree” and “disagree”), responses were distributed more evenly across all five scale steps, whereas when the response scale was bordered by wider or more absolute labels (i.e., “strongly agree” and “strongly disagree”), responses were concentrated more on the intermediate scale steps; even more subtle adverbial modifiers (e.g., strongly vs. completely agree) may influence response behavior;
The intensity hypothesis (cont’d) prior evidence that different intensities are associated with different adverbs (e.g., Cliff 1959; Smith et al. 2009), but little evidence that different adverbs lead to differential category endorsement; Hintensity: Endpoint response categories are endorsed less frequently if their labels are more intense.
The familiarity hypothesis • according to the open choice model in linguistics, the only constraint on the concatenation of words is that the rules of grammar be respected; • in contrast, the idiom principle states that combinations of words are used in conventional patterns, which leads to the phenomenon of collocation: certain word combinations co-occur more often than would be expected based on their individual frequencies (e.g., strong tea vs. powerful tea); • “of the large repertoire of amplifiers available for expressing a high degree of intensity, speakers rely on a rather limited set of items, and only a few of these are used with great frequency” (Altenberg 1991, p. 133)
The familiarity hypothesis (cont’d) • formulaic sequences such as collocations are not only used more frequently by language users and are thus more familiar, but are also processed more quickly (Conklin and Schmitt 2008; Durrant2008); • based on research on meta-cognitive experiences, this suggests that more familiar, high-frequency labels are more likely to be endorsed (Alter et al. 2007; Fang, Singh, and Ahluwalia 2007; Hawkins and Hoch 1992; Unkelbach 2007; Winkielman et al. 2003) : • repeated exposure to a stimulus has beneficial effects on processing fluency; • repeated and more fluently processed statements are more likely to be rated as true; • stimulus repetition and fluent processing increase liking, preference and confidence judgments;
The familiarity hypothesis (cont’d) since collocations have been shown to be processed more quickly, familiar (vs. unfamiliar) labels, because of their greater processing fluency, should be chosen more confidently as the true and preferred response option; Arce-Ferrer (2006) showed that respondents who were less familiar with the meaning of the intermediate scale categories were more likely to engage in extreme responding and therefore less likely to endorse response options with which they were not familiar; Hfamiliarity: Endpoint response categories are endorsed more frequently if their labels are more familiar.
Two alternative hypotheses to explain the effect of response category labels Intensity hypothesis: • Hintensity: Endpoint response categories are endorsed less frequently if their labels are more intense. Familiarity hypothesis: • Hfamiliarity: Endpoint response categories are endorsed more frequently if their labels are more familiar.
Study 1: Scaling intensity and familiarity • Do different methods for scaling the intensity and familiarity of response category labels lead to similar results? If the intensity or familiarity of scale labels is to have a reliable effect on responses to questionnaires, consistent differences in the perceived intensity and fluency of category labels should emerge across respondents. • Can we identify endpoint labels that vary significantly in intensity and familiarity for use in subsequent studies? We need two labels that imply contradictory responses under the intensity and familiarity hypotheses.
Study 1 (cont’d) • Label intensity • Direct ratings of intensity (0 = neutral; 10 = 100% agreement) • Pairwise comparisons of intensity (“Which expression indicates the stronger sense of agreement?”) • Label familiarity • Direct ratings of familiarity (0 = we never use this term in day-to-day language; 10 = we use this term very often in day-to-day language) • Pairwise comparisons of familiarity (“Which expression is more commonly used in day-to-day language?”) • Lexical decision task (press a button labeled ‘end category label’ or ‘not an end category label’ for 6 endpoint labels and five non-endpoint labels) • Word frequency counts in corpora of texts (Google hits, available for specific word combinations in particular countries and languages)
Study 1: Method Sample 1: 83 undergraduates; pairwise comparisons of intensity and familiarity of six endpoint labels; Sample 2: 112 respondents (mean age 32.03, 66% female) from an online panel; direct ratings of intensity and familiarity on 11-point scales; Sample 3: 125 undergraduates (57% female); lexical decision task;
Study 1: Results (cont’d) for intensity, the correlation of the means obtained from the paired comparison and direct rating tasks is .92; the correlations of the means derived from the four familiarity methods range from .94 to .97; thus, there is considerable consistency in respondents’ judgments of the perceived intensity and familiarity of different category labels; ‘sterkeens’ (strongly agree) consistently emerged as one of the least intense and least familiar labels, while ‘volledigeens’ (completely agree) surfaced as one of the most intense and most familiar labels;
Study 2 • Direct test of the intensity and familiarity hypotheses: The endorsement rate for a high intensity and high fluency label should be relatively low if the intensity hypothesis is true, and it should be relatively high if the fluency hypothesis is true.
Measuring response distributions • A major challenge is to measure differences in response distributions that are not item-specific and independent of substantive content; • To do this, we need to observe patterns of responses across heterogeneous items (i.e., items that do not share common content but have the same response format): • Deliberately designed scales consisting of heterogeneous items (Greenleaf 1992) • Random samples of items from scale inventories (Weijters, Geuens & Schillewaert 2010)
Study 2: Method • online survey with Dutch-speaking panel members of an online market agency (N = 218); • the respondents ranged in age from 20 to 65 years (M = 43.2, SD = 11.7), 47 % were female, and 58% had schooling beyond secondary school; • respondents were randomly assigned to questionnaires varying the endpoint labels (5-point scale): • ‘completely (dis)agree’ (high intensity/familiarity) • ‘strongly (dis)agree’ (low intensity/familiarity) • questionnaire consisted of • 16 heterogeneous items (4 pages with 4 items per page) taken from unrelated scales (e.g., “Air pollution is an important worldwide problem”, “I often give compliments to others”); • pairwise comparisons of the two response category labels in terms of intensity and familiarity;
Study 2: Results The manipulation of intensity/familiarity was successful; The findings support the familiarity hypothesis:
Study 3 the results of Study 2 are presumably due to the fact that more familiar labels are more easily processed and that this ease of processing inadvertently influences respondents’ answers to survey questions; as long as the relevance of meta-cognitive experiences is not called into question, people consider this information as diagnostic and incorporate it into their judgments by relying on naïve theories such as, “If the information comes to my mind easily, it must be true or I must like it”; however, when the diagnosticity or informational value of meta-cognitive experiences is called into question, people discount this information and either turn to alternative naïve theories such as “The information comes to mind easily because I have often heard it” or use the cognitive content of the stimulus;
Study 3 (cont’d) this suggests that making respondents aware that more familiar response labels may attract more responses and that this may lead them to more readily select the category label “completely (dis)agree” should eliminate the previously observed familiarity effect;
Study 3: Method • Online survey with 122 respondents of a university panel (67.2% women, average age of 29 years); • 2 x 2 between-participant design: • intensity/familiarity of the endpoint labels manipulated as in the previous study (‘completely agree’ vs. ‘strongly agree’); • awareness of the label familiarity effect (depending on whether the following instructions were given before or after the collection of the DV): • In questionnaires, there are several different ways of labeling response categories (e.g., “strongly (dis)agree” or “completely (dis)agree”). Previous research has shown that labels that are used more commonly in day-to-day language are more often selected as a response. This happens irrespective of the true opinion of the respondent on the subject of the question. • DV is the number of endpoints responses to 16 heterogeneous questions;
Study 3: Results • the findings support the familiarity hypothesis in the unaware condition, but the effect goes away when respondents are made aware of the label familiarity effect :
Implications of the category labeling effect for cross-cultural research • response category labels can affect findings in a single-language context (e.g., meta-analytic comparisons), but they are particularly important in cross-cultural research, where labels have to be translated; • two types of translation: • literal • idiomatic • some authors have emphasized the need to choose scale anchors that are equal in intensity (e.g., Harzing 2006), and prior research has demonstrated that supposedly similar terms may differ in intensity across languages (e.g., ‘definitely’ vs. ‘bestimmt’; see Smith et al. 2009); • however, translated adverbial modifiers may also differ in familiarity;
Schematic representation of the translation process (based on Bassetti and Cook 2011)
Study 4: Method approx. 200 English- or French-speaking respondents in five regions (nationality/language combinations) of North America and Europe; five endpoint labels in each language; 16 heterogeneous items from Greenleaf (1992), rated on 5-point scales; pairwise comparisons of the six labels plus “agree” or “d’accord” in terms of intensity and familiarity;
Study 4: Results Intensity and familiarity ratings by region Note: Correlation between the familiarity ratings and the natural logarithm of the number of Google hits was at least .88.
Study 4: Results • linear regression of the number of endpoint responses on • label intensity • label familiarity • 4 dummy variables representing the five regions • only label familiarity had a significant effect (Standardized B = .38, p < .05, R² = .14); • in other words, the number of endpoint responses increases as a function of label familiarity, regardless of country and language;
Study 5 demonstration that familiarity is a viable determinant of extreme responding differences between regions in a large-scale international survey; illustration of how to construct and use relative measures of familiarity and extreme responding based on secondary data only;
Study 5: Method • 13,520 respondents from 17 European regions; • 16 heterogeneous items based on Greenleaf (1992); • use of fully labeled 7-point response scales; • familiarity: relative measure of familiarity as the natural logarithm of the ratio of the number of Google hits for the 1st and 7th category (strongly agree or disagree) to the number of Google hits for the 2nd and 6th category (agree or disagree); • endorsement: relative endorsement of the 1st and 7th vs. the 2nd and 6th response categories (natural logarithm);
Sample descriptive statistics Pan-European study (Study 7 and 8)
Study 5: Results Note: Standardized B = .68, p < .05, R² = 46%.
Study 5: Results (cont’d) prior research has generally attributed differences in response distributions in cross-cultural comparisons to nationality and national culture; our findings demonstrate that different labels may vary in terms of familiarity, which can lead todifferent response patterns across languages; in particular, if the endpoint label used in a certain language is more familiar than the one used in another language (relative to the adjacent category label), it is likely that the endpoint will be selected more frequently in the former than in the latter language;
Discussion: Summary of findings response category labels that are more commonly used in day-to-day language (i.e., that are more familiar) lead to higher endorsement of their associated response categories; respondents do not simply scale response categories along an intensity dimension and then map their latent response to the best-matching category, but they are also influenced by the familiarity of the labels; the category label familiarity effect can be eliminated by making respondents aware of the potentially biasing effect of label familiarity, the problem may be particularly serious in cross-cultural research when different languages are used; however, researchers can control for differences in label familiarity across languages based on secondary data;
Consequences of the response category label effect • if certain labels attract more responses, this leads to bias; • Baumgartner and Steenkamp (2001) discuss how extreme responding biases scale scores: • if the modal scale response is above the midpoint, average scores will be inflated; • if the modal scale response is below the midpoint, average scores will be deflated; • relationships between variables can also be biased;
Consequences of the response category label effect (cont’d) imagine a situation in which the strength of a relationship is compared across two groups and labels that differ in familiarity are used to collect data in the two groups; the DV, an attitudinal variable (ATT), is measured on an agreement rating scale, and the IV (e.g., AGE in years) is measured on an objective scale and hence not affected by differences in label familiarity; compared to respondents in the unfamiliar label condition, respondents in the familiar label condition who have a moderately positive or negative true attitude will exhibit a more extreme positive or negative observed attitude because they are more likely to endorse the endpoints; this can result in a steeper observed slope and thus a stronger relationship between the objective antecedent and the observed attitude in the familiar label condition;
Consequences of the response category label effect (cont’d) • using data from Study 2: • ATT: “I try to avoid food that is high in cholesterol” • IV: Age in years
Implications formultilingual survey research • translations usually imply a trade-off between the attempt to be literal and the attempt to be idiomatic; • optimizing equivalence: use response category labels that are equally familiar in different languages (rather than literal translations or words with equal intensity); e.g., the German and Dutch labels “vollkommeneinverstanden” and “volledigeens” are literal translations (similar to “completely agree”), but in German this expression is more familiar, resulting in more endpoint responses than in Dutch(based on Study 5); • back-translation of response category labels may not help because it may result in literal rather than idiomatic translations and the familiarity of the labels in different languages may differ;
Identifying appropriate endpoint labels in two languages