Download
1 / 37
380 likes | 537 Vues
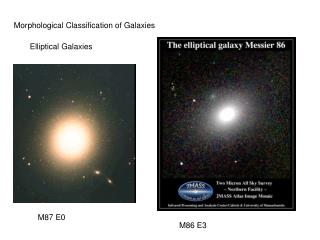
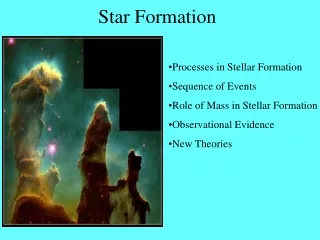
MORPHOLOGICAL CLUSTER CLASSIFICATION AND STAR FORMATION. Florent Rostagni. OUTLINE. Context Sample Algorithm for detection and classification Star formation X-ray – optical study Perspectives - Conclusion. STANDARD MODEL OBSERVATIONS. D r / r ~ 200. D T/T ~10 -5.

E N D
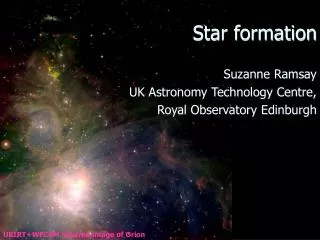
MORPHOLOGICAL CLUSTER CLASSIFICATION AND STAR FORMATION Florent Rostagni
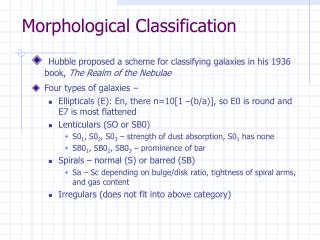
OUTLINE Context Sample Algorithm for detection and classification Star formation X-ray – opticalstudy Perspectives - Conclusion
STANDARD MODELOBSERVATIONS Dr/r~ 200 DT/T ~10-5 Galaxy distribution CosmicMicrowave Background t Present Big-Bang ~380 000 years GRAVITATION
STANDARD MODELSIMULATIONS > 100 galaxies 1013 M. £ M £ 1015 M. ~ 1 Mpc STRUCTURES: FILAMENTS CLUSTERS
STANDARD MODEL structure formation rate cosmological parameters dynamical state of clusters
STANDARD MODELSTRUCTURE GROWTH 1.5 1 0.5 1.5 1 0.5 z z Cohn & White 2005
² Cohn et al. 2001
GALAXY CLUSTERS GALAXIES GAS DARK MATTER 1930 optical 5% of the mass 1980 X-ray 15% of the mass 1980 gravitationnallens 80% of the mass
GALAXY CLUSTERS REGULAR CLUSTER IRREGULAR CLUSTER
GALAXY CLUSTERSidealrelaxed cluster Projectedgalaxydisribution King profile 1 Mpc Galaxyorbits gaussianvelocity distribution
MORPHOLOGICAL CLASSIFICATION OPTICAL X-RAY Galaxy contents Wavelets Adaptive kernel Centroid shift Power ratio elliptcity • projection effects • point distribution • + whole cluster + no projection effect + continuousfield - cluster core SKY PLANE
SAMPLE Redshift information along the line of sight SDSS 25% of the sky spec. complete up to r=17.5 best surveyatlowzavailable C4 clusters: detectedusing 4 colors
SAMPLEC4 Search for concentration of galaxies in a 4 color space Galaxywith 6-th nearest distance neighbour = C4 cluster center All galaxies withinr15 are assigned to the cluster
SAMPLEC4 • Results: • 90% complete • 95% pur • 98% of X-Ray clusters • 90% of Abell clusters
SAMPLEC4 • Centering: • Definition of the cluster center (6-th nearestneighbour in color space) • Piling up of structures along the line of sight: • Due to only use of colors • Loss of some C4 clusters • Split of C4 clusters in severalunits
SDSS SAMPLE • Whatwe have: • 218 catalogs (fields) of galaxies around 10Mpc of C4 clusters withenoughmeasuredspectra • Whatwe use: • Position • Photometric magnitude in r-band • Spectroscopic (60%) and photometricredshift
CLASSIFICATION Search for galaxy concentrations in phase space 6 coordinates of galaxies (a,d,z) onlyavailable 3D (a,d,z) ? 1D (z) + 2D (a,d) Construction of distribution functionsbased on wavelets + measure of deviations to relaxedones
CLASSIFICATIONalong the line of sight Fields z f(z) wavelets
CLASSIFICATIONalong the line of sight Ngal>50 Fields z f(z) Packets wavelets EMMIX Peaks
CLASSIFICATIONalong the line of sight Ngal>50 Fields z f(z) Packets wavelets EMMIX Peaks
CLASSIFICATIONalong the line of sight 156 peaks
CLASSIFICATIONalong the line of sight List of peaks 2 cases distant peaks close peaks POTENTIALLY RELAXED INTERACTION
CLASSIFICATIONin sky plane Isolated or interactingpeak (a,d) Densitymaps ( 2-10Mpc) Cluster catalog wavelets SExtractor Ngal>Ngalmax / 10 Sub-stucturecatalog 3Mpc densitymaps (0.5-3Mpc) Cluster catalog SExtractor wavelets Ngal>Ngalmax / 10
CLASSIFICATIONin sky plane Sub-stucturecatalog 3 cases weightcriteria: 1:10 1 clump one main clump severalheavyclumps POTENTIALLY RELAXED INTERACTION
CLASSIFICATION POTENTIALLY RELAXED INTERACTION PEAKS CLUMPS POTENTIALLY RELAXED RELAXED INTERACTION INTERACTION INTERACTION INTERACTION
CLASSIFICATIONresults Isolated clusters rate ~ 13% • 218 C4 fields • 110 packets • 156 peaks • 98 isolatedpeaks • 216 clusters • 29 isolated clusters
CLASSIFICATIONon goingwork • Classification: • relaxed • interacting • Improvements: • introduceellipticity in classification • interacting: elaboratesub-categorieswith bimodal ....
X-RAY – OPTICALCOMPARISON Different dynamical time Different morphologies Dynamical state + Fusion stage Collaboration with H. Bourdin Data for 18 C4 clusters with XMM Galaxy: collisionless Gas: collisional
X-RAY – OPTICALCOMPARISON Optical X-Ray
X-RAY – OPTICALCOMPARISON • Temperaturemaps • dynamical state, cold core
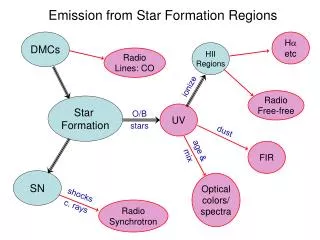
STAR FORMATION • Whatis the influence of cluster dynamical state on star formation rate of their host galaxies? • Does cluster merging speed up star formation in galaxies or in contrarydoesit stop star formation? • Is it the case for all galaxies? • If not, where are star forming galaxies and/or star formation stopping galaxies?
STAR FORMATION • Galaxy type determined by spectra: • Unclassified or not used • Star forming • Composite • AGN • Low S/N liner • Fraction of SF galaxies in clumps
CONCLUSION Classification of galaxy clusters ~13 % isolated clusters
PERSPECTIVES Evolution of fusion rate with time • Use of zphot: • Impact of its use on classification, control of errors • Application of classification to CFHT-LS data: • more galaxies • deeper