Download
1 / 1
10 likes | 181 Vues
Detailed Characteristics of Weekend Effects in Chinese Cities. EGU2011-678. Yong-Sang Choi 1 , and Bo-Ram Kim 1 1 Department of Environmental Science and Engineering, Ewha Womans University, Seoul 120-750 Korea.

E N D
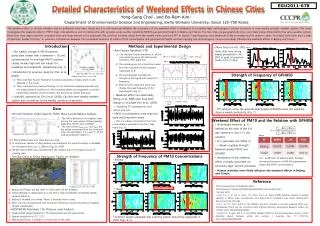
Detailed Characteristics of Weekend Effects in Chinese Cities EGU2011-678 Yong-Sang Choi1, and Bo-Ram Kim1 1Department of Environmental Science and Engineering, EwhaWomans University, Seoul 120-750 Korea The weekend effect in climate variables and air pollutants have been found, but it is still equivocal whether the occurrence of the weekend effect is attributed to boundary-layer anthropogenic aerosol processes or semi-weekly synoptic weather system. This study investigates the weekend effect in PM10 mass concentrations, and its relationship with synoptic-scale weather variability (850hPa geopotential height) in Beijing and Tianjin. The two cities are geographically close, very likely being influenced by the same weather system. Both cities have large industrial complexes that emit large amount of air pollutants. We used the anomaly values from the weekly means and took FFT to extract 7-day frequency and amplitude of the anomalies and its random orders. As results, both cities have a peak of spectrum nearby 0.14 day-1 in summers. Correlations between the normalized variances of surface PM10 concentration and geopotential height are low, implying that anthropogenic causes more likely influence the weekend effects in Beijing and Tianjin. Introduction Methods and Experimental Design • More focus on JJA, 2002 Fig. 1. Fig 6 • Fast Fourier Transform (FFT) • The weekly change in PM10 (aerosol particulate matter with a diameter < 10 m) concentrations for the high-PM10 stations clearly reveals high and low values for weekdays and weekends, respectively (Fig. 1). Both cities have strong weekly periodicity in JJA, 2002 (a peak of spectrum nearby 0.14 (7-1day)). The discrete Fourier transform, X, of the time series by using the fast Fourier transform (FFT) algorithm. Fig. 2 The periodogram for a finite time series was then calculated as the squared magnitude of X: • Introduction to previous study by Choi et al. (2008) Strength of Frequency of GPH850 The periodogram indicates the strength of the signal with respect to frequency. Artificial cyclic data with noise may change the peak frequency of the periodogram (Fig. 2) They used Fast Fourier Transform to extract periodicity of data, which is also adopted in this study. They confirmed the previous findings on the interaction between aerosols and the meteorological conditions in the boundary layers and suggested a possible relationship between cloud formation and aerosols at weekly timescale. Fig 7 Adapted from Choi et al. 2008 • Weekend effect has seasonality (Gong et al., 2006) and long-term change in its phase (Ho et al., 2009) • → Operating FFT separately for each season and year. • Scientific questions to Choi et al. (2008): Can the semi-weekly weather system also contribute to the weekly variation of aerosols? ㅡ: normal, ㅡ; normal + noise Fig. 3 Data • FFT analysis using the geopotential height at 850hPa does not explicitly show a weekly periodicity (Fig. 7). • PM10 concentrations have seasonal cycle and long-term trend. • → The row values converted to the mass concentration anomalies from the 7-day mean (Fig. 3). • API (Air Pollution Index) Data for PM10 Mass Concentrations Analysis The API is defined as the highest index among the sub-indices of three leading pollutants: PM10, SO2, andNO2. The sub-indices-IPM10, ISO2, and INO2-are the values converted from the observed mass concentrations (C) in µg m-3 of the leading pollutants (Table 1). Weekend Effect of PM10 and the Relation with GPH850 • Normalized variance( ) is defined as the ratio of the 6-8 day variance to the 2-13 day variance. • R2 is generally low (Table 3) • → Weak coupling strength between weekly PM10 and GPH850 • Generation of the weekend effect is largely grounded on boundary-layer aerosol processes. Table 3 PM10-polluted days and clean days are used. A continuous dataset of daily aerosol concentrations for spectral analysis is available for the period from Jun, 5, 2000 to Aug, 30, 2009. Winter season (DJF) was excluded from the analysis due to the large amount of missing data. • NCEP/NCAR Reanalysis I for Pressure Level Analysis Geopotential height dataset for 17 pressure level and 28 sigma levels. Spatial resolutions of 2.5°*2.5°. Beijing and Tianjin is located in a same grid of the data. Strength of Frequency of PM10 Concentrations • R2 : Coefficient of determination between normalized variances of 850 hPageopotential height and PM10 concentrations • Beijing Fig 4 • Human activities more likely influence the weekend effects in Beijing and Tianjin. Adapted from Choi et al. 2008 Beijing and Tianjin are big cities in China with 135 km distance. Tianjin (Beijing) is categorized as a city with a high (moderate) normalized weekly variance.(Table 2) Beijing is situated on a valley, Tianjin is situated near a coast. Both cities are characterized with monsoon-influenced climate according to Köppen climate classification. Reference • Tianjin Fig 5 Strong Weekly Periodicity ! • http://www.sepa.gov.cn/quality/air.php3 • http://www.esrl.noaa.gov/psd/data/gridded/data.ncep.reanalysis.html • GoogleEarth • Choi, Y.-S., C.-H. Ho, D. Chen, Y.-H. Noh, and C.-K. Song (2008), Spectral analysis of weekly variation in PM10 mass concentration and environment conditions over China, Atmospheric Environment, 42, 655–666. • Ho, C.-H., Y.-S. Choi, and S.-K. Hur (2009), Long-term changes in summer weekend effect over northeastern China and the connection with regional warming, Geophysical Research Letters, 36, L15706, doi:10.1029/2009GL039509. • Gong, D.-Y., D. Guo, and C.-H. Ho (2006), Weekend effect in diurnal temperature range in China: Opposite signals between winter and summer, J. Geophys. Res., 111, D18113, doi:10.1029/2006JD007068. • Summer season generally has a strong weekly periodicity, especially in 2002 (Figs. 4-5). • Two Big Cities in China, Beijing and Tianjin, for Analysis Adapted from Choi et al. 2008