Download

1 / 42
420 likes | 705 Vues
Air Pollution II: Air Pollution in Hong Kong. Major sources of air pollution in Hong Kong Air Quality Objectives and Air Pollution Index (API) 3. Indoor Air Quality Objectives.

E N D
Air Pollution II: Air Pollution in Hong Kong • Major sources of air pollution in Hong Kong • Air Quality Objectives and Air Pollution Index (API) 3. Indoor Air Quality Objectives According to the World Health Organization, two-thirds of the 800,000 premature deaths caused by air pollution globally occur in Asia. Adapted from Time Magazine: Choking on Growth, Rapid economic development has led to filthy air. The good news: this is a mess that can be cleaned upBY BRYAN WALSH
1. Major sources of air pollution in Hong Kong • Power Station Emissions • Vehicle Emissions (fuel powered vehicles) • Incinerator Emissions (from chemical waste treatment plant, hospitals, industrial buildings, cement factory) • Chimney Emissions (food industry) • Landfill Gas (from waste treatment landfill sites) • Air conditioning emissions
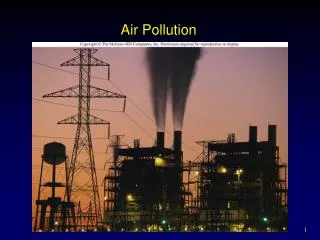
Air Pollution Green house Gas Emissions have not been reduced due to the use of coal for electric power production.
Major point sources of air pollution in Hong Kong: Power Plants and Chemical Waste Treatment Plant Castle Peak Power Stations Tsing Yi Chemical Waste Treatment Plant Air Port Lamma Island Power Stations
Hong Kong Island North Fish Farms in Mainland China Residential Area in Lamma Island. South Lamma Island Power Station, Hong Kong Electric Co. Ltd. Coal fired plants equipped with flue gas desulphurization (removing 90% of SO2emission), and clean burners with low Nox.
Selection of Power Plant Fuels Coal Diesel Oil Natural Gas Nuclear power Wind power! Power Station Gas Clean Up CLP Castle Peak B Station has been using low NOx Coal burner since 1991.
Solutions to reduce air pollution from power stations • Electroprecipitation • New Burner (low NOx) • FGD (flue gas desulphurization (removing 90% of SO2emission) • Restricted in South-western part of Hong Kong • Develop nuclear power (Di Ya Bay Nuclear Power Plant) • IMPROVE ENERGY EFFICIENCY, e.g. use energy saving devices!! • Wind Power.
Major Sources: Power Station Adapted from EPD, 1994.
Adapted from Hong Kong SAR Government (2006). Government’s Environmental Policy for the Power Sector.
Renewable Energy for the future?? What can we do to reduce local production of air pollutants?? [1] Set targets for renewable energy utilization. One turbine only equal to just less than 0.1% of power supply. Our power consumption is greater than any normal European country! [2] SAVE Energy could reduce pollution too.
Air Pollution from diesel vehicles Adapted from EPD, 1998. Tunnel Effects trap Air Pollutants between buildings Can lead to severe impact of vehicle emissions on health!
Lowered the limit of benzene content in petrol from 5% to 1% in April, 2000. • ULSD (ultra low sulphur diesel introduced in July, 2000. • LPG taxis to replace diesel taxis. • Particulate trap retrofitting program to reduce emissions. • Include emission test as part of the roadworthiness test for petrol vehicles. (Adapted from EPD, 2001.)
Adapted from “Improving the Air Quality in Hong Kong- A Progress Report November 2005” by EPD,
Particulate trap in small diesel vehicles, e.g. Taxis. Adapted from EPD, 2000. Catalytic converter in heavy vehicles, e.g. light buses to huge buses.
Mass Transit Railway to reduce pollution from vehicles? Adapted from a KCRC poster.
香港的大氣污染從那裡來? Transboundary Air Pollution 跨境污染 Adapted from EPD, 1999.
Cross Boundary Air Pollution is Serious!! From Air Emissions (Power plants and Factories) in Guangdong Province and vehicles in Hong Kong fueled by gases from mainland China Adapted from “Improving the Air Quality in Hong Kong- A Progress Report November 2005” by EPD,
Pollutant Sources Accumulated Air pollutants Mountains Wind East Bound Wind 如何產生逆溫層?
Air Pollution Control Strategies Initiated by HKEPD Enhanced Air Pollution Control Measures in Hong Kong • Implement the following emission reduction measures with a view to fully achieving the emission reduction targets set by Hong Kong and Guangdong by 2010. • tighten the motor petrol standard to Euro IV • negotiate with power companies measures to further reduce emissions and increase the use of natural gas in electricity generation • launched a consultation exercise in the last quarter of 2004 on a scheme to control VOC emissions from paints, printing and selected consumer products. .
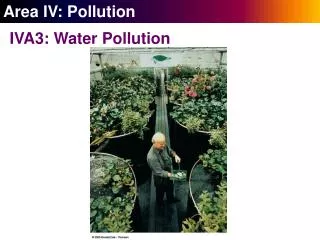
2. Air Quality Objectives • Odour • Smoke, Dust, Coking Fumes, Paint, etc. • Complaints about dark smoke emission, prosecution is not effective in my opinion • Our air quality is getting worse and not only handicap our international image as financial centre, but also affect our health.
Air Pollution Monitoring Station: roof-top design to reflect true air quality in the area in general. Adapted from EPD, 1999.
General Considerations • Concentrations per cubic meter • Smaller particles go deeper into your lung • Time of Exposure: Sampling Duration (collected for how long) Sampling Time (Diurnal Change) • Location of sampling sites, height of sampling • Computer extrapolation or estimation • Review of objectives
Objectives for the following seven substances: • Sulphur Dioxide (SO2) • Total suspended particulates (TSP) • Respirable suspended particulates (RSP) • Nitrogen Dioxide (NO2) • Carbon Monoxide (CO) • Ozone (O3) • Lead (Pb) Adapted from EPD, 1994.
Pollutant Health effects of pollutant at elevated ambient levels SO2 Respiratory illness; reduced 1ung function; morbidity and mortality rates increase at higher levels. • TSP Respirable fraction has effects on health. • RSP Respiratory illness; reduced lung function; cancer risk for certain particles; morbidity and mortality rates increase at higher levels. • NO2 Respiratory irritation; increased susceptibility to respiratory infection; lung development impairment. • CO Impairment of co-ordination; deleterious to pregnant women and those with heart and circulatory conditions. Photochemical Oxidant e.g. O3 Eye irritation; cough; reduced athletic performance; possible chromosome damage. Pb Affects cell and body processes; likely neuro-psychological effects, particularly in children; likely effects on rates of incidence of heart attacks, strokes and hypertension. Adapted from EPD website
AQO limits (permissible guidelines) • SO2: 1 hour: 800ug/m3 (<3 times per year) 24 hour: 350ug/m3 (< 1 per year) Annual: 80 ug/m3 • TSP 24 hour: 260ug/m3 (<1 per year) Annual: 80 ug/m3 • RSP (PM10, 10 micron particulate) 24 hour: 180 ug/m3 (< 1 per year) Annual: 55 ug/m3
AQO limits • NO2 1 hour: 300 ug/m3 (<3 per year) 24 hour: 150 ug/m3 (<1 per year) Annual: 80 ug/m3 • CO 1 hour: 30,000 ug/m3 (< 3 per year) 8 hour: 10,000 ug/m3 (<1 per year) • O3 1 hour: 240 ug/m3 (<3 per year) • Lead: 3 months 1.5 ug/m3
Pollutant Concentration in micrograms per cubic metre (i) Average Time 1 hr (ii) 8 hrs (iii) 24 hrs (iii) 3 mths (iv) 1 yr (iv) Sulphur Dioxide 800 350 80 TSP (v) 260 80 RSP (v) 180 55 Nitrogen Dioxide 300 150 80 Carbon Monoxide 30000 10000 Ozone (vi) 240 Lead 1.5 (i)Measured at 298K (25C) and 101.325 kPa (one atmosphere). (ii)Not to be exceeded more than three times per year. (iii)Not to be exceeded more than once per year. (iv)Arithmetic means. (v)Respirable suspended particulates means suspended particles in air with a nominal aerodynamic diameter of 10 micrometres and smaller.
空氣污染監測站點 (Air Pollution Monitoring Stations) Adapted from EPD website.
Roadside: TSP, RSP & NO2 Ambient: TSP, RSP Adapted from EPD, 1998.
Maximum Annual Pollutant Concentrations and Objectives in 2006
API and Concentrations of Pollutants (g/m3, except CO) API value TSP (24h) RSP (24h) SO2 (24h) CO (8h, mg/m3) O3 (1h) NO2 (1h) 500 1000 600 2620 27.5 1200 3750 400 875 500 2100 46 1000 3000 300 625 420 1600 34 800 2260 200 375 350 800 17 400 1130 AQO 100(b) 260 180 (150) 50 (EU) 350 (365) 10 240 (235) 300 Annual AQO 50(b) 80 55 (50) 80 5 120 - 0 0 0 0 0 0 - *( ) values of API in U.S.
Air Pollution Index • How the API is calculated? • Standards are outdated. E.g. PM2.5 is used in US as 65 mg/m3, or 35 mg/m3 in EU. They are considering to use PM1. • What to do when the API exceeds 100? Hiding at home? Stop vehicle to run on the street? Just health warning? • There are clinical evidence to show that air pollution caused higher emergency ward mortality. • Geographic coverage of API: Road-side, Urban, New Development and Industrial. Each district want to have its own API !!
摘自明報 Potentially Toxic Emission (Dioxins, PCBs??) from Waste Treatment Plant ??? ?? Other incinerator in Hong Kong ??
Toxic Chemicals in Local Air 汽油粒子物質 Diesel particulate matter 柴油車輛 丁二烯三 1, 3-Butadiene 汽油車輛、塑膠製造 苯 Benzene 汽油車輛、油站、電力工程 金屬工業、焚化爐、報紙印刷 六價鉻 Hexavalent chromium 電鍍工廠、油漆 鎘 Cadmium 金屬工業、焚化爐 醫療廢物焚化爐、電力工程 鎳 Nickel 金屬工業、電力工程 全氯乙烯 Perchloroethylene 乾洗、成衣製造、修理汽車 甲醛 Formaldehyde 電力工程 乙烯基氯 Vinyl chloride 塑膠製造 2,3,7,8 – 四氯氧芴 2,3,7,8 – Tetrachlorodibenzofuran 汽油車輛、金屬工業、焚化爐 鉛 Lead 醫療廢物焚化爐、油漆、電力工程
4. Indoor Air Quality Objectives • Air flow • Bacteria • Carbon monoxide and dioxide (CO and CO2) • Formaldehyde (HCHO) • Nitrogen dioxide • Ozone (O3) • Radon • Relative humidity • Respirable particulates (RSP) • Toal volatile organic carbon (TVOC)
Results of 1995 survey(data from Indoor Air Quality Consultation Paper, 1999). • Investigated 40 offices and 38 public area from cinema, restaurants, to shopping malls. • 32% of these premises are sick buildings, 1/3 of people interviewed said that they were not satisfied with the air quality indoor. • 80% of restaurants, 60% of cinemas, and 37.5% of shopping malls had exceeded limits of carbon dioxide. Many detected with various chemicals such as ozone, formaldehyde, RSP, benzene, bacteria, etc, exceeded the limits or objectives proposed by EPD.
Parameters Unit 8h averaged values (at 25C/101.325 kPa) Class I Class II Class III CO2 ppm < 800 < 1,000 < 5,000 CO g/m3 < 2,000 < 10,000 < 29,000 RSP g/m3 < 20 < 180 --- NO2 g/m3 < 40 < 150 < 5,600 O3 g/m3 < 50 < 120 < 200 HCHO g/m3 < 30 < 100 < 370 TVOC g/m3 < 200 < 600 --- Rn Bq/m3 < 150 < 200 --- Bacteria cfu/m3 < 500 < 1,000 --- Temp C 20 – 25.5 < 25.5 --- Relative humidity % 40 – 70 < 70 --- Air Flow m/s < 0.2 < 0.3 --- Proposed Indoor Air Quality Objectives
REVISION EXERCISES • List chemicals included in calculation of API. • List chemicals included in indoor air objectives. • Discuss how API can help improving air quality in Hong Kong. What are the limitations of API. • Discuss possible health effects of air pollution in Hong Kong. • Review current air pollution problem in Hong Kong based on API data from last year, write a proposal to the Director of EPD to address these problem.