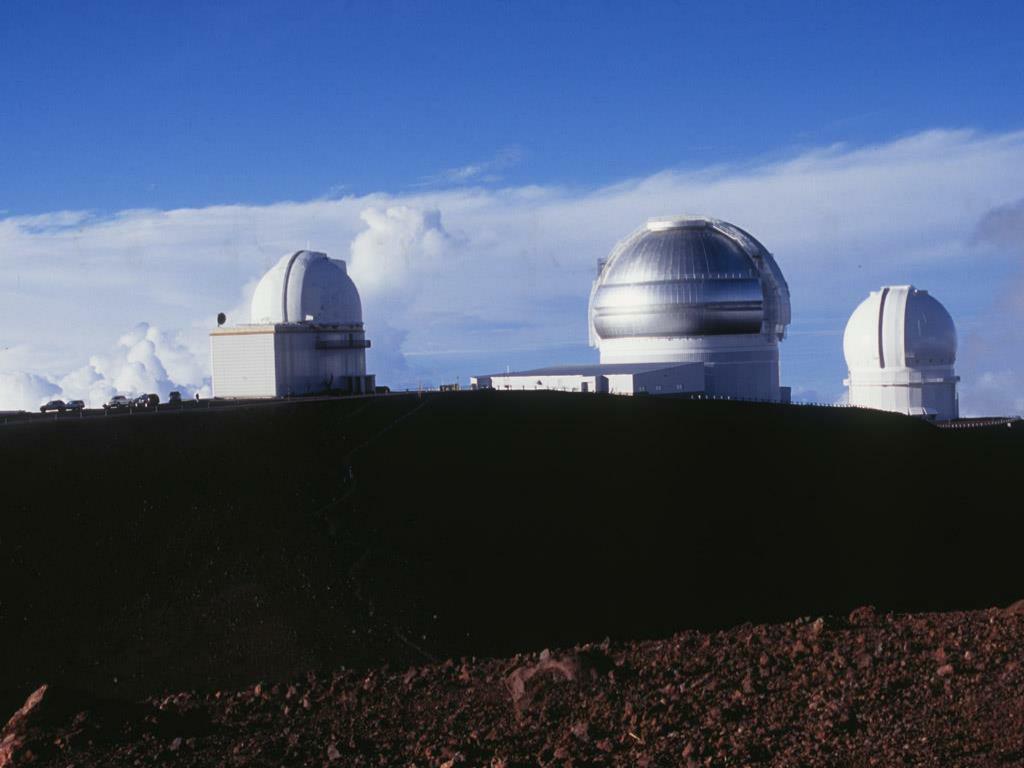
Light Pollution Stellar Evolution. Lab Notes. Be sure you have started your “ report ” lab. Constellation presentations next week. Observatory field trips…. Night Lights. http://apod.nasa.gov/apod/ap101104.html. Limiting Magnitude and Light Pollution. Limiting Magnitude.
Une image / un lien ci-dessous est fourni (tel quel) pour télécharger la présentation
Politique de téléchargement : le contenu du site vous est fourni TEL QUEL pour votre information et votre usage personnel ; il ne peut être vendu, concédé sous licence ni partagé sur d’autres sites sans l’accord de son auteur.Le contenu vous est fourni TEL QUEL, pour votre information et votre usage personnel uniquement.Téléchargez la présentation en cliquant sur ce lien.Lors du téléchargement, si vous ne parvenez pas à télécharger une présentation, l’éditeur a peut-être supprimé le fichier de son serveur.Pendant le téléchargement, si vous ne parvenez pas à obtenir une présentation, le fichier a peut-être été supprimé par l’éditeur.
Limiting Magnitude • Limiting Magnitude is a measure of the dimmest star visible from a given location. • Center of a big city: ~2.0 • Suburbs: ~4.5 • Downtown Durango: ~5.5 • La Plata County (FLC observatory): ~6.5 • Depends on observer experience • Depends on local glare • Depend on how dark adapted your eyes are. You should wait 20-30 minutes to measure this. 6
Limiting Magnitude • Use stars of known magnitude (e.g. Little Dipper) 7
Limiting Magnitude • Count the stars in a well-defined region • Chose one of the predefined star regions that is overhead • Count the number of stars visible within the region boundary • Look up the number on the published tables to find the corresponding limiting magnitude 8
Light Pollution • Generally not an issue in La Plata county. • Durango has a dark sky ordinance, but only for new construction. • Fort Lewis is making progress with outside light fixtures. 15
Light Pollution Earth at Night Credit: C. Mayhew & R. Simmon (NASA/GSFC), NOAA/ NGDC, DMSP Digital Archive 16
Light Pollution From IDA Website: http://www.darksky.org/images/sat.html 17
Distance Scale • If you know brightness and distance, you can determine luminosity. • Turn the problem around… 22
Distance Scale • If you know brightness and distance, you can determine luminosity. • Turn the problem around… • If a star is on the main sequence, then we know its luminosity. So • If you know brightness and luminosity, you can determine a star’s distance. 23
Distance Scale • Spectroscopic Parallax - the process of using stellar spectra to determine distances. • Can use this distance scale out to several thousand parsecs. 24
H-R diagram review • The H-R diagram shows luminosity vs. temperature. • It is also useful for describing how stars change during their lifetime even though “time” is not on either axis. • How to do this may not be obvious. • Exercise - Get in groups of ~four and get out a blank piece of paper. 31
Group Exercise • As a group, create a diagram with “financial income” on the vertical axis, and “weight” on the horizontal axis. • Use this graph to describe the past and future of a fictitious person (or a group member). • Label significant events, for example • birth • college • retirement • death 32
Stellar Evolution 1 - interstellar cloud - vast (10s of parsecs) 2(and 3) - a cloud fragment may contain 1-2 solar masses and has contracted to about the size of the solar system 4 - a protostar • center ~1,000,000 K • Too cool for fusion, but hot enough to see. (photosphere ~3000 K) • radius ~100x Solar 33
Stars A and B formed at the same time. Star B has 3 times the mass of star A. Star A has an expected lifetime of 3 billion years. What is the expected lifetime of star B? A) more than 9 billion years B) about 9 billion years C) 3 billion years D) about 1 billion years E) less than 1 billion years 41
Stars A and B formed at the same time. Star B has 3 times the mass of star A. Star A has an expected lifetime of 3 billion years. What is the expected lifetime of star B? A) more than 9 billion years B) about 9 billion years C) 3 billion years D) about 1 billion years E) less than 1 billion years 42
Stellar Lifetimes • Proportional to mass • Inversely proportional to luminosity • Big stars are MUCH more luminous, so they use their fuel MUCH faster. • The distribution of star types is representative of how long stars spend during that portion of their life. • Example - snapshots of people. 43
Figure 11.21Newborn Star on the H–R Diagram 5 - Gravity still dominates the radiation pressure, so the star continues to shrink. Can have violent “winds” streaming outwards; often bipolar flow from poles; T-Tauri phase 50
Connexion au compte
Connectez-vous pour publier votre contenu sur SlideServe.