Issues summary
Issues summary. Pre workshop comments. Scope of the 2006 Update. Common definition of peak Avoided cost and E3 Calculator updates for peak and critical peak How RA affects (1) and (2), and should RA drive the peak and critical peak definitions

Issues summary
E N D
Presentation Transcript
Issues summary Pre workshop comments
Scope of the 2006 Update • Common definition of peak • Avoided cost and E3 Calculator updates for peak and critical peak • How RA affects (1) and (2), and should RA drive the peak and critical peak definitions • Improve consistency in load data and peak methods • Consider whether other peak definitions are needed • Improvements to load shapes • Calculation platform • Correct calculator anomalies • Peak savings and consistent counting period • Further refinements for common E3 calculator • Update natural gas prices in avoided cost forecast
Agenda • Day 1 • 10am to 12pm: Overview and “Other” issues. • 12pm to 1pm: Lunch • 1pm to 3pm: Load Shapes • 3pm to 5pm: Peak Definitions • Day 2 • 9am to 11am: Peak Costs • 11am to 12pm: Resource Adequacy • 12pm to 1pm: Lunch • 1pm to 2pm: Load shape research plan recommendation • 2pm to 4pm: Spillover issues
Schedule • Workshops today and tomorrow to gather participant input for E3 consultant report • Draft E3 report on update issues by February 20th • Workshops on draft E3 report (March?) • Final E3 report, incorporating feedback from workshops (April?) • Comments on E3 report (May?) • Commission decision in June or July 2006.
Other Issues (not load shapes, peak definitions, or avoided cost refinements)
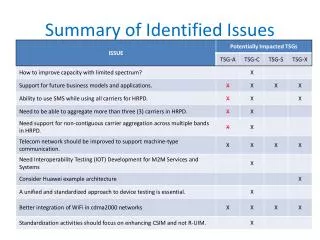
Other Issues (7) Determine the most appropriate calculation platform to use for the program evaluations (i.e., spreadsheet or database). (8) Correct calculation anomalies with respect to Standard Practice Manual cost-effectiveness indicators/methodologies. (9) Convert annual savings to peak savings for all measures using a consistent counting period (useful lives > 2 years). (10) Identify areas where further refinements of input assumptions/ model algorithms may be needed to create a common E3 calculator for use by all implementers. (11) Update the natural gas prices in the E3 calculator based on current forecasts and consider whether the Commission should revise the ex ante assumptions of avoided costs to reflect these updated gas price forecasts, for the purpose of evaluating the performance of 2006-2008 energy efficiency programs.
Calculation Platform • PG&E • Likes the transparency and flexibility of Excel, but file sizes are an issue. • SDG&E • Prefers to use SAS. Would conform to common input and output formats • DRA seeking • Transparency of inputs assumptions & loads • Consistent model input/output format and calculation methodology • (Nice to have) links to DEER or workpapers • SCE • Cautions on other applications, but nothing stated on current use.
E3 Calculator Applications • Reporting • SCE: No. Use reporting formats being developed in EE rulemaking • PG&E: No • Ex-post cost effectiveness • SCE: No. Use simpler spreadsheets for ex-post calculations (e.g.: pre-1998 TOU spreadsheets) • Forecasting • PG&E: No
Calculator Anomalies • SDG&E • NA • SCE • Work with ED re direct installs • DRA • Direct install costs should be included in TRC as admin costs
Direct Install Costs • Such costs have historically been treated as “customer incentives” (transfer payments) in both the TRC and PAC cost effectiveness calculations. • The Standard Practice Manual states that “the costs in [the TRC test] are the program costs paid by both the utility and the participants plus the increase in supply costs for the periods in which load is increased. Thus all equipment costs, installation, operation and maintenance, cost of removal (less savage value), and administration costs, no matter who pays for them, are included in this test.” (Standard Practice Manual, July 2002, p.18)
Counting Period • Both considering and ignoring useful lives is sufficient (SDG&E) • Useful lives must be incorporated, and snapshots at particular points in time (DRA)
Common E3 Calculator • Not possible in current format because of IOU-specific information (SDG&E) • Commonality of inputs and outputs can be achieved (SDG&E, SCE, DRA, PG&E) • Load shapes should not necessarily be the same (SCE) • Peak reduction methodology should be consistent (DRA)
Natural Gas Update • Use 2005 Integrated Energy Policy Report inputs (SDG&E, PG&E) • Feb 2005 EIA update (SDG&E) • Dec 2005 early release EIA Update (PG&E believes last forecasts PRIOR to 2006 program should be used for planning, authorizing, and funding.) • SCE does not necessarily endorse the EIA or CEC forecasts. SCE recommends a blend of market forwards and a fundamentals forecast. • TURN supports an update – but not as an excuse for higher incentive payments. • DRA supports updates, and recommends consistency with IEPR and LTPP cycles.
Comparison of EG Natural Gas (Forecasts: CEC, EIA 2005, EIA 2006) CEC Reference, http://www.energy.ca.gov/2005publications/CEC-600-2005-026/CEC-600-2005-026-REV.PDF 2005 EIA Referece: http://www.eia.doe.gov/oiaf/aeo/supplement/sup_t2t3.xls 2006 EIA Reference: http://www.eia.doe.gov/oiaf/aeo/excel/aeotab_3.xls
Load Data Issues (4) Improve the consistency in underlying load shape data and the methods by which that data is translated into peak savings estimates. (5) Consider whether different definitions (different than that recommended in item (1)) of peak demand reductions for energy efficiency are needed for cost-effectiveness evaluation, establishment of energy efficiency peak reduction goals, evaluating achievement of those goals, critical peak pricing, and resource adequacy counting. (6) Make improvements to measure load shapes, including: • More accurate sources of data than those currently used. • Improvements to the consistency in underlying load shape data and the methods by which that data is translated into peak savings estimates. • Specifications for the type of load shapes to be developed. • Period for defining demand impacts (e.g.: 60-minute, run time averages). • Calibration of results to annual usage and end-use survey data. • Management of data options (how to meaningfully synthesize hundreds of simulation options per measure). • How demand will be measured ex-post.
Shape Cautions • PG&E’s hourly shapes reflect the average usage of an end use, not necessarily the savings profile for a measure. • TOU shapes are generally old and difficult to reproduce.
Measure versus Impact Shapes • Not an issue if reductions are proportional to base measure usage • Could be a significant issue for HVAC and shell improvements because of AC duty cycles. • Has been a major issue with two stage compressors.
Load Data Comments • Using the best data available (SDG&E) • In most cases TOU data is sufficient (SDG&E) • Inconsistencies exist in TOU periods, but should not be considered significant (SCE) • Unclear about inconsistencies in DEER methodology (SCE) • DRA’s desire for consistency: • Granularity (hourly vs TOU) • Vintage (last update) • Baseline assumptions
Existing Summer Peak TOU Period Definitions • Summer Season • Summer Peak Period Hours
Improvements to Load Shapes • M&E efforts in future for temperature sensitive loads. Until then, current methods are adequate. (SDG&E) • DEER Database should be updated to ensure consistent methodology. Until then utilities should continue to use the best available data. (SCE) • Work towards hourly data in the long term (SCE) • CZ specific data for temp sensitive loads, and load shapes specific to end-use sectors. (DRA) • Don’t use uncalibrated load data, and balance timing resource and accuracy considerations.
Peak Questions (1) Develop a common definition of peak (and critical peak or other terms, as appropriate) demand reductions to use in evaluating energy efficiency resources across proceedings. (2) Update the interim avoided cost methodology/E3 calculator to more accurately reflect the impact of energy efficiency, distributed generation and demand response on peak and critical peak loads, including consideration of how critical peak avoided costs should be used in the context of energy efficiency measures that are not fully dispatchable. (3) Consider how the recently adopted resource adequacy counting rules adopted in D.05-10-042 and D.04-10-035 might affect (1) and (2) above.6 For example, should the definition of peak or critical peak only apply to load reductions that count toward meeting resource adequacy requirements under the “top down” approach adopted by those rules?
Proposed Peak Definitions • SDG&E: • 300 hour Coincident Peak (if temp responsive) • DEER for non temp responsive • TOU on-peak is adequate fall back for T&D • SCE: • Average demand reduction during summer peak (conservative estimate), or current TOU estimates for on-peak reductions. • TURN: • Critical peak period, such as top 100 hours • DRA: • Forecasting: 10 yr weather normalized system load factor • Evaluating performance: System coincident peak hour (after testing validity) • PG&E • Move toward RA definitions.
Peak Impact Examples • SCE Example: Demand Reduction = Basecase Max – EE Max
Different Peak Definitions • None needed (SDG&E, SCE) • Given any new definition, future goals should not be unreasonable (SCE) • Straw dog analyses of alternate definitions are needed, and attention to cycling equipment is important (TURN) • Peak demand reductions for goals assessment should be NET (DRA) • Tailor definition to application. If procurement cost reduction is the value of EE, use RA.
Peak Costs Sufficiently Captured? • SDG&E: • Refinements possible, but adequate for now. Does not support creating smaller intervals if data is lacking. • SCE: • Replace PX shapes with TOD values adopted in the RPS rulemaking • TURN: • Additional refinement needed to value critical peak versus summer peak. May be an additional value during critical peak periods. • PG&E: • No. Gen capacity should be separated then combined with RA requirement reduction. Critical peak needs careful definition to be useful.
Dispatchability • SDG&E: • No dispatchable programs funded in EE portfolio. • SCE: • No revisions needed for EE programs. • PG&E: • Dispatchable programs treated as DR. • Would earn higher energy values than EE.
Dispatchability Adder Discussion • Higher average avoided cost by TOU period dues to ability to discard lower value hours • Higher value due to option value, which increases the value of a dispatchable program in the “shoulder” value hours. • Hourly avoided costs are point estimates, but there is a distribution around each point. • For low cost and very high cost hours, the dispatch decision is unaffected by the distribution --- so no option value change. • For shoulder hours, combining the distribution of avoided costs with the strike price could yield higher value that just using the point estimate of avoided cost
Resource Adequacy • Included as a reduction to load, so counting not an issue (SDG&E, SCE, TURN, DRA) • GROSS reductions should be counted as reductions, (not Net) (DRA) • RA Topdown approach reflects an interest in physical resources and is only an INTERIM protocol (DRA) • Assess difference between MW peak reductions from an RA perspective, so adjustments could be made in the future if needed. (PG&E)
Other Comments • TURN recommends a technical work group • TURN recommends that differing TOU period definitions for IOUs be assessed • TURN recommends immediate work to more reasonably reflect the lighitng and HVAC impacts.