Download
1 / 22
220 likes | 241 Vues
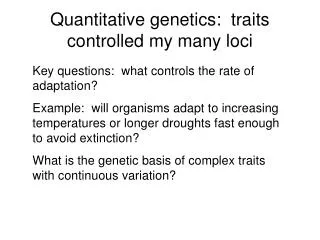
This study investigates the genetic basis of natural variation in traits and the mechanisms by which genes contribute to phenotypic differences. It explores questions related to the number of loci involved, the types of genes responsible, and the evolution of pleiotropy.

E N D
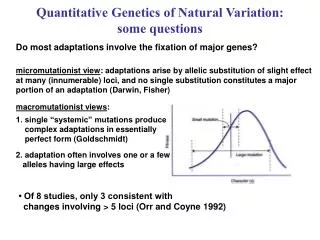
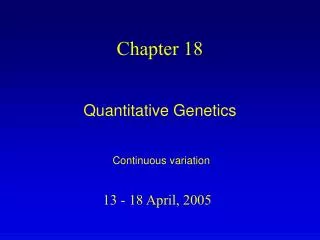
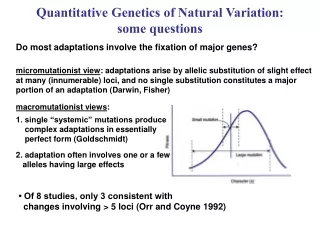
Quantitative Genetics of Natural Variation: some questions Do most adaptations involve the fixation of major genes? micromutationist view: adaptations arise by allelic substitution of slight effectat many (innumerable) loci, and no single substitution constitutes a major portion of an adaptation (Darwin, Fisher) macromutationist views: 1. single “systemic” mutations produce complex adaptations in essentially perfect form (Goldschmidt) 2. adaptation often involves one or a few alleles having large effects • Of 8 studies, only 3 consistent with changes involving > 5 loci (Orr and Coyne 1992)
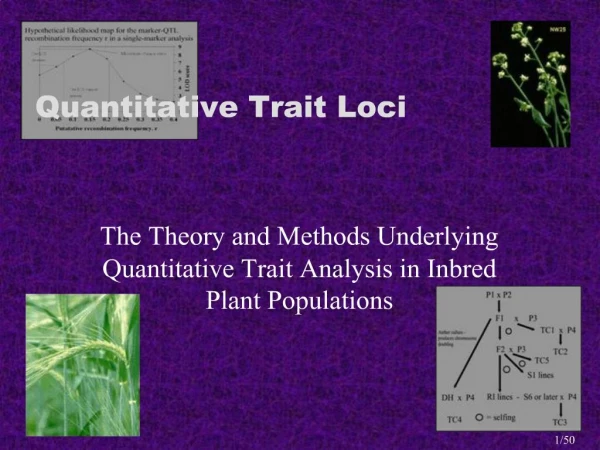
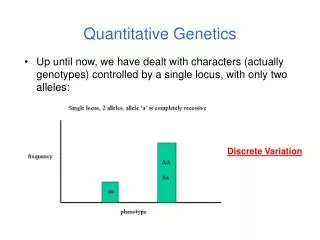
Quantitative Genetics of Natural Variation: some questions • How many loci contribute to naturally occurring phenotypic variation, and what are the magnitudes of their effects? • What sorts of genes —and changes in these genes—are responsible for trait variation within populations (e.g., transcription factors, structural genes, metabolic genes) • Do the same genes that contribute to variation within species also contribute to variation between species? • What genes underlie evolutionary novelties? • What are the genetic bases for evolutionary novelties? • How do pleiotropic effects of genes evolve? Answers require a mechanistic approach towards identifying the relevant loci and how genetic differences are translated into phenotypic differences
Quantitative traits depend on multiple underlying loci one locus + environment two loci + environment one locus four loci + environment many loci + environment
A2A2 A1A2 A1A1 genotype – a 0 d + a genotypic value Phenotypic Value and Population Means P = G + E Phenotypic value = Genotypic value + Environmental Deviation Genotype Freq Value Freq x Val A1A1 p2 +a p2a A1A2 2pq d 2pqd A2A2 q2 -a -q2a Sum = Pop Mean = a(p-q) + 2dpq
Timing of Metamorphosis The majority of organisms on planet earth have complex life cycles Predictable Larval Habitat Hatching Metamorphosis Predictable Ephemeral Pond Time
Thyroid Hormone Receptors as Candidate Genes for Variation in Metamorphic Timing Hypothalamus TRH Pituitary TSH Thyroid TH Target cells T4 deiodionation T3 TRs transcription An extreme difference in metamorphic timing
Thyroid Hormone Receptors : A Hypothetical Example Thyroid Hormone Receptor Alpha Genotype A1A1 A1A2 A2A2 Timing of Metamorphosis (Days) 200 160 150 d -15 -a a -25 25 0 Homozygote Midpoint (175)
Genotype Freq Value Freq x Val A1A1 p2 25 p2(25) A1A2 2pq -15 2pq(-15) A2A2 q2 -25 -q2(25) Sum = Pop Mean = 25(p-q) + 2(-15)pq (adds time) (reduces time) p = f(A1) q = f(A2) A1A1 A1A2 A2A2 Mean 0 0 -25 2.25 -6.3 -12.25 6.25 -7.5 -6.25 12.25 -6.3 -2.25 25 0 0 0.0 0.3 0.5 0.7 1.0 1.0 0.7 0.5 0.3 0.0 -25 (150) -16.3 (158.7) -7.5 (167.5) 3.7 (178.7) 25 (200)
Let’s Consider a Second Locus Thyroid Hormone Receptor Alpha Genotype A1A1 A1A2 A2A2 Timing of Metamorphosis (Days) 200 160 150 0 Thyroid Hormone Receptor Beta Genotype A1A1 A1A2 A2A2 Timing of Metamorphosis (Days) 200 140 0 -a a -30 30 Homozygote Midpoint (170)
Genotype Freq Value Freq x Val A1A1 p2 30 p2(30) A1A2 2pq 0 2pq(0) A2A2 q2 -30 -q2(30) Sum = Pop Mean = 30(p-q) + 2(0)pq (adds time) (reduces time) P = f(A1) Q = f(A2) A1A1 A1A2 A2A2 Mean -30 (140) -12 (158) 0 (170) 12 (182) 30 (200) 0 0 -30 2.7 0 -14.7 0 0 0 14.7 0 -2.7 30 0 0 0.0 0.3 0.5 0.7 1.0 1.0 0.7 0.5 0.3 0.0
Consider the joint effect of both TH Loci Total Range = 2Sa=110 Tha A1A1 Thb A1A1 Tha A2A2 Thb A2A2 Timing of Metamorphosis (Days) 227.5 117.5 0 -a a 55 55 Average Homozygote Midpoint (172.5) Overall Mean = Sa(p-q) + S2dpq
Genotypic value is not transferred from parent to offspring; genes are. Need a value that reflects the genes that an individual carries and passes on to it’s offspring Breeding Value Empirically: An individual’s value based on the mean deviation of its progeny from the population mean. Theoretically: An individual’s value based on the sum of the average effects of the alleles/genes it carries.
. a1 = pa + qd - [ a (p – q) + 2dpq ] population mean f (A1) f (A2) Average Effect of an Allele Type of Values and Freq Mean value Population Average gamete of gametes of genotypes mean effect of gene A1A1 A1A2 A2A2 a d -a A1 p q pa + qd -a(p-q) + 2dpq q[a+d(q-p)] A2 p q -qa + pd -a(p-q) + 2dpq -p[a+d(q-p)] average effect of An: an = mean deviation from the population mean of individuals that received An from one parent, if the other parent’s allele chosen randomly a1 = q [ a + d (q – p)] a2 = –p [ a + d (q – p)]
Theoretically: An individual’s value based on the sum of the average effects of the alleles/genes it carries. Genotype Breeding Value 2a1 A1A1 A1A2 A2A2 a1 + a2 2a2
Average Effects Frequency q (A2 orTHa2) 0.00.30.50.7 1.0 : THa1 0 9.3 12.5 13.3 10 :THa2 -40 -21.7 -12.5 -5.7 0 d = -15; a = 25
Breeding Values - THa example A2 or Tha2 Pop MeanA1A1A1A2A2A2 q = 1.0 150 20 10 0 q = 0.7 158.7 26.6 7.6 -11.4 q = 0.5 167.5 25 0 -25 q = 0.3 178.7 18.6 -12.4 -43.4 q = 0.0 200 0 -40 -80
Sum of average effects across loci = Breeding Value (A) A1A1 A1A2 A2A2 2a1 a1 + a2 2a2 B1B1 B1B2 B2B2 2a1 a1 + a2 2a2 + (breeding values) (breeding values) G = A + D = + Genotypic Value Additive effects of genes Dominance deviation
breeding value deviations from population mean phenotypic value of individual genotypic value of individual genotypic value breeding value genotypic value dominance deviation G = A + D G = G1 + G2 + I12 two-locus: interaction Partitioning the phenotypic value P = G Pop Mean P = A1 + D1 + A2 + D2 + I12 d=3/4a, q = 1/4
One locus, two alleles P = A + D One locus, two alleles + environmental variation P = A + D + E environmental deviation Environmental effects on phenotypes
Amount of genetic variation in a population depends on # of genotypes, genotypic value, and gene frequencies. More variation Less variation 0.75 0.75 p = 0.5 p = 0.9 0.50 0.50 0.25 0.25 10 10 11 9 11 9 A1A1 A1A2 A2A2 A1A1 A1A2 A2A2 Mean Mean
a = d = 0.07 V . VP = VA + VD + VI + VE f (A1) total phenotypic variance additive genetic variance dominance genetic variance interaction (epistatic) genetic variance environmental variance Components of phenotypic variation P = A + D + I + E Variance partitioning: VP = VG + VE • Phenotypic variation can be decomposed into additive genetic and other variation • Relative contributions of different sources depend on allele frequencies