Quantitative and Behavior Genetics
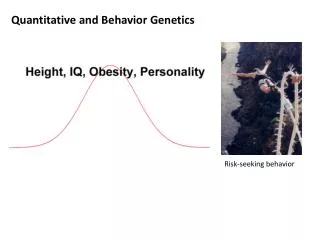
Quantitative and Behavior Genetics. Risk-seeking behavior. Quantitative Genetics A. Types of Variation - discontinuous. Quantitative Genetics A. Types of Variation - discontinuous Qualitative - Categorical . frequency. white. purple. Quantitative Genetics

Quantitative and Behavior Genetics
E N D
Presentation Transcript
Quantitative and Behavior Genetics Risk-seeking behavior
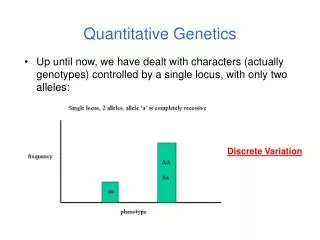
Quantitative Genetics • A. Types of Variation • - discontinuous
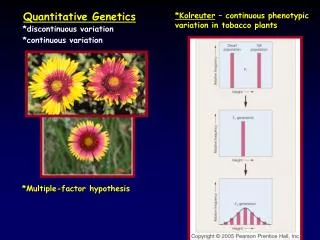
Quantitative Genetics • A. Types of Variation • - discontinuous • Qualitative - Categorical frequency white purple
Quantitative Genetics • A. Types of Variation • - discontinuous • Qualitative - Categorical frequency purple white ‘order’ doesn’t matter
Quantitative Genetics • A. Types of Variation • - discontinuous • Qualitative - Categorical • Quantitative - Meristic frequency 10 15 20 25 30 ‘order’ does matter – ‘ordinal’ scale.
Quantitative Genetics • A. Types of Variation • - discontinuous • Qualitative - Categorical • Quantitative – Meristic • - continuous • Quantitative
Quantitative Genetics • A. Types of Variation • B. Genetic Contributions • - discontinuous - continuous
Quantitative Genetics • A. Types of Variation • B. Genetic Contributions • - discontinuous • Qualitative - Categorical female male
Quantitative Genetics • A. Types of Variation • B. Genetic Contributions • - discontinuous • Qualitative - Categorical No Contribution - Environmental female male
Quantitative Genetics • A. Types of Variation • B. Genetic Contributions • - discontinuous • Qualitative - Categorical • Single Locus
Quantitative Genetics • A. Types of Variation • B. Genetic Contributions • - discontinuous • Qualitative - Categorical • Multiple Loci – Threshold Response • many genes contribute to an increased • probability of type II diabetes, in • addition to environmental factors such • as diet and exercise (multifactorial).
Quantitative Genetics • A. Types of Variation • B. Genetic Contributions • - discontinuous • Qualitative - Categorical • Quantitative – Meristic • Multiple Loci – ‘polygenic’ • Nilsson-Ehle (1909) – wheat color
Quantitative Genetics • A. Types of Variation • B. Genetic Contributions • - discontinuous • Qualitative - Categorical • Quantitative – Meristic • Multiple Loci – ‘polygenic’ • Nilsson-Ehle (1909) – wheat color
Quantitative Genetics • A. Types of Variation • B. Genetic Contributions • - discontinuous • Qualitative - Categorical • Quantitative – Meristic • Multiple Loci – ‘polygenic’
Quantitative Genetics • A. Types of Variation • B. Genetic Contributions • - discontinuous • Qualitative - Categorical • Quantitative – Meristic • Multiple Loci – ‘polygenic’ ¼ = 1/41 One locus 1/16 = 1/42 two loci Can model the number of genes contributing in an additive way to a trait by determining genes (n) necessary to explain the fraction of F2 offspring that express a parental type (x). X = 1/4n Measure ‘x’, estimate n. # of categories ~ 2n+ 1 1/64 = 1/43 three loci 1/256 = 1/44 Four loci
Quantitative Genetics • A. Types of Variation • B. Genetic Contributions • - discontinuous • - continuous
Quantitative Genetics • A. Types of Variation • B. Genetic Contributions • - discontinuous • - continuous No Contribution - Environmental Sun, water, soil nutrients
Quantitative Genetics • A. Types of Variation • B. Genetic Contributions • - discontinuous • - continuous Multiple Loci – ‘polygenic’ Can model the number of genes contributing in an additive way to a trait by determining genes (n) necessary to explain the fraction of F2 offspring that express a parental type (x). X = 1/4n Measure ‘x’, estimate n. # of categories ~ 2n+ 1
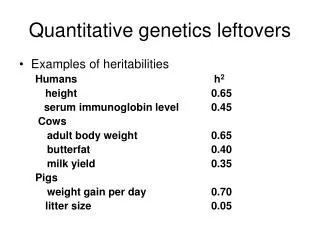
Quantitative Genetics • A. Types of Variation • B. Genetic Contributions • C. Estimating the Genetic Contribution to Phenotypic Variation • 1. Heritability • - ‘Broad sense’ heritability is the proportion of phenotypic variation in a population, in a given environment, that is due to genetic variation.
Quantitative Genetics • A. Types of Variation • B. Genetic Contributions • C. Estimating the Genetic Contribution to Phenotypic Variation • 1. Heritability • - ‘Broad sense’ heritability is the proportion of phenotypic variation in a population, in a given environment, that is due to genetic variation. So, suppose we observe variation in plant size among genetically different plants growing in a field: This variation in phenotype might be due to a combination of genetic and environmental differences between them. V(phen) = V(env) + V(gen) H2 = Vg/Vp
Quantitative Genetics • A. Types of Variation • B. Genetic Contributions • C. Estimating the Genetic Contribution to Phenotypic Variation • 1. Heritability • - ‘Broad sense’ heritability is the proportion of phenotypic variation in a population, in a given environment, that is due to genetic variation. IF these plants were all grown under the same environmental conditions (‘common garden’ experiment), then there is no variation in the environment and the variation we observe can be attributed to genetic differences. V(phen) = 0 + V(gen) H2 = Vg/Vp
Quantitative Genetics • A. Types of Variation • B. Genetic Contributions • C. Estimating the Genetic Contribution to Phenotypic Variation • 1. Heritability • - ‘Broad sense’ heritability is the proportion of phenotypic variation in a population, in a given environment, that is due to genetic variation. IF these plants were all grown under the same environmental conditions (‘common garden’ experiment), then there is no variation in the environment and the variation we observe can be attributed to genetic differences. V(phen) = V(gen) BUT this relationship is ONLY true in this environment!! H2 = Vg/Vp
Quantitative Genetics • A. Types of Variation • B. Genetic Contributions • C. Estimating the Genetic Contribution to Phenotypic Variation • 1. Heritability In a different environment, phenotypic and genetic variation may be expressed differently.
Quantitative Genetics • A. Types of Variation • B. Genetic Contributions • C. Estimating the Genetic Contribution to Phenotypic Variation • 1. Heritability So, in a large population experiencing a range of environments: V(phen) = V(env) + V(gen) + V(g*e) V(g*e) is a genotype by environment interaction; reflecting the fact that genotypes may respond in different ways to changes in the environment.
Quantitative Genetics • A. Types of Variation • B. Genetic Contributions • C. Estimating the Genetic Contribution to Phenotypic Variation • 1. Heritability Suppose we had populations of each genotype, and these were the mean heights of these populations. Genotype C F Height Stanford Mather Environment
Quantitative Genetics • A. Types of Variation • B. Genetic Contributions • C. Estimating the Genetic Contribution to Phenotypic Variation • 1. Heritability Suppose we had populations of each genotype, and these were the mean heights of these populations. Genotype C F Height XS V(env) XM Stanford Mather Environment
Quantitative Genetics • A. Types of Variation • B. Genetic Contributions • C. Estimating the Genetic Contribution to Phenotypic Variation • 1. Heritability Suppose we had populations of each genotype, and these were the mean heights of these populations. Genotype C F Height XC V(gen) XF Stanford Mather Environment
Quantitative Genetics • A. Types of Variation • B. Genetic Contributions • C. Estimating the Genetic Contribution to Phenotypic Variation • 1. Heritability Suppose we had populations of each genotype, and these were the mean heights of these populations. Genotype C F Height XCS XFS XCM XFM = The effect of environment IS THE SAME for the two genotypes: (g*e) = 0. Stanford Mather Environment
Quantitative Genetics • A. Types of Variation • B. Genetic Contributions • C. Estimating the Genetic Contribution to Phenotypic Variation • 1. Heritability So, in this comparison: V(phen) = V(env) + V(gen) + V(g*e) Sig. Sig. ns
Quantitative Genetics • A. Types of Variation • B. Genetic Contributions • C. Estimating the Genetic Contribution to Phenotypic Variation • 1. Heritability Suppose we compare B and E. Genotype B E Height Stanford Mather Environment
Quantitative Genetics • A. Types of Variation • B. Genetic Contributions • C. Estimating the Genetic Contribution to Phenotypic Variation • 1. Heritability Environmental effects are significant Genotype B E Height XS V(env) XM Stanford Mather Environment
Quantitative Genetics • A. Types of Variation • B. Genetic Contributions • C. Estimating the Genetic Contribution to Phenotypic Variation • 1. Heritability Genetic effects are insignificant; means don’t differ. Genotype B E Height XC XE V(gen) = 0 Stanford Mather Environment
Quantitative Genetics • A. Types of Variation • B. Genetic Contributions • C. Estimating the Genetic Contribution to Phenotypic Variation • 1. Heritability There is a significant ‘G x E’ interaction. Genotype B E Height XCS XFS XCM XFM >> The effect of environment IS NOT THE SAME for the two genotypes!! Stanford Mather Environment
Quantitative Genetics • A. Types of Variation • B. Genetic Contributions • C. Estimating the Genetic Contribution to Phenotypic Variation • 1. Heritability In a different environment, phenotypic and genetic variation may be expressed differently. So, in this comparison: V(phen) = V(env) + V(gen) + V(g*e) Sig. ns Sig.
Quantitative Genetics • A. Types of Variation • B. Genetic Contributions • C. Estimating the Genetic Contribution to Phenotypic Variation • 1. Heritability • - ‘Broad sense’ heritability is the proportion of phenotypic variation in a population, in a given environment, that is due to genetic variation. • - ‘Narrow sense’ heritability is the proportion of phenotypic variation that is due to ‘additive’ genetic effects; as opposed to the effects of ‘dominance’ or ‘epistasis’ • Vg = Va + Vd+ Ve h2 = Va/Vp
Quantitative Genetics • A. Types of Variation • B. Genetic Contributions • C. Estimating the Genetic Contribution to Phenotypic Variation • 1. Heritability • 2. Measuring Heritability • a. Correlation: See if the phenotype of the offspring correlates with the phenotype of the parents, in the same environment.
Calculate the average phenotype of two parents, and calculate the average phenotype of their offspring. Graph these points across sets of parents and their offspring. The slope of the best-fit line (least-squares linear regression) describes the strength of the “heritability” of the trait.
Quantitative Genetics • A. Types of Variation • B. Genetic Contributions • C. Estimating the Genetic Contribution to Phenotypic Variation • 1. Heritability • 2. Measuring Heritability • a. Correlation: See if the phenotype of the offspring correlates with the phenotype of the parents, in the same environment. • b. Experiment: If most of the phenotypic variation is due to ‘additive’ genetic variance, then the traits should respond quickly to selection.
X1 Consider a population that varies for a given trait, with mean = X1
X1 Consider a population that varies for a given trait, with mean = X1 Suppose some with an extreme phenotype are selected for breeding, and they have mean = Xb Xb The selection differential is computed as Xb – X1. So, if X1 = 5, and Xb = 8, then the selection differential = 3.0
X1 Consider a population that varies for a given trait, with mean = X1 Suppose some with an extreme phenotype are selected for breeding, and they have mean = Xb Xb The selection differential is computed as Xb – X1. So, if X1 = 5, and Xp = 8, then the selection differential = 3.0 Suppose the offspring from our breeding population has the following distribution, with mean = X2 X1 X2 The response to selection = X2 – X1. If X2 = 6.5, then the response to selection = 1.5.
X1 Consider a population that varies for a given trait, with mean = X1 Suppose some with an extreme phenotype are selected for breeding, and they have mean = Xb Xb The selection differential is computed as Xb – X1. So, if X1 = 5, and Xp = 8, then the selection differential = 3.0 Suppose the offspring from our breeding population has the following distribution, with mean = X2 X1 X2 The response to selection = X2 – X1. If X2 = 6.5, then the response to selection = 1.5. h2 = r/s = 1.5/3.0 = 0.5
Quantitative Genetics • A. Types of Variation • B. Genetic Contributions • C. Estimating the Genetic Contribution to Phenotypic Variation • 1. Heritability • 2. Measuring Heritability • a. Correlation: See if the phenotype of the offspring correlates with the phenotype of the parents, in the same environment. • b. Experiment: If most of the phenotypic variation is due to ‘additive’ genetic variance, then the traits should respond quickly to selection. • c. MZ-DZ twin studies:
Quantitative Genetics • 2. Measuring Heritability • c. MZ-DZ twin studies: Vp = Vg + Ve • - MZ twins: Vg = 0, so Vp for a trait = only Ve.
Quantitative Genetics • 2. Measuring Heritability • c. MZ-DZ twin studies: Vp = Vg + Ve • - MZ twins: Vg = 0, so Vp for a trait = only Ve. • - DZ twins: Us DZ twins to measure Vg = Vp – Ve (mz) • - problem: MZ twins are often treated more alike than DZ twins. So, many of their similarities may be environmental, too. Thus, Ve is underestimated. • - when this artificially LOW Ve is subtracted from Vp for DZ twins, it OVERESTIMATES the genetic contribution to that trait. For MZ twins, clothes choice shows very little variation. (Ve = 0.1).
Quantitative Genetics • 2. Measuring Heritability • c. MZ-DZ twin studies: Vp = Vg + Ve • - MZ twins: Vg = 0, so Vp for a trait = only Ve. • - DZ twins: Us DZ twins to measure Vg = Vp – Ve (mz) • - problem: MZ twins are often treated more alike than DZ twins. So, many of their similarities may be environmental, too. Thus, Ve is underestimated. • - when this artificially LOW Ve is subtracted from Vp for DZ twins, it OVERESTIMATES the genetic contribution to that trait. For MZ twins, clothes choice shows very little variation. (Ve = 0.1). DZ twins dress different (Vp = 10.0). Vg = Vp – Ve = 10.0 – 0.1 = 9.9 H2 for ‘clothes wearing’ = Vg/Vp = 9.9/10.0 = 0.99. WOW! WHAT A HUGE GENETIC CONTRIBUTION!!!
Quantitative Genetics • 2. Measuring Heritability • c. MZ-DZ twin studies: Vp = Vg + Ve • Hmmmm… MZ twins are treated more similarly than DZ twins in their homes, so Ve differs between the groups. Hmmmm…. Suppose we compare MZ and DZ twins reared apart, through adoption? Then Ve will be the same across groups, and greater similarity among MZ twins must be a function of greater genetic similarity. MZ DZ “The Jim Twins” Ve is the same for both groups
Quantitative Genetics • 2. Measuring Heritability • c. MZ-DZ twin studies: Vp = Vg + Ve • Greater similarity among MZ twins must be a function of greater genetic similarity. Born in 1940. Reunited in 1979. both named “Jim” by adoptive parents Both married women named Linda. Then married women named Betty. Both had sons named James Allen. Both had dogs named Toy. Both liked Miller Lite. Both hated baseball. Both raised in Ohio. Both had high blood pressure. Both had vasectomies. Both had migraines. Both were sheriffs. Both owned Chevy’s. “The Jim Twins”
Quantitative Genetics • Behavior Genetics • Behaviors are complex responses to stimuli, dependent upon: • - genetically influenced capacity to receive stimuli • - genetically influenced physiology integrating stimuli • - genetically influenced physiological response • - environmental context of the stimulus • - environmental context of potential response
Quantitative Genetics • Behavior Genetics • Behaviors are complex responses to stimuli, dependent upon: • - genetically influenced capacity to receive stimuli • - genetically influenced physiology integrating stimuli • - genetically influenced physiological response • - environmental context of the stimulus • - environmental context of potential response So, we should expect behaviors to be multifactorial (environmental effects) with a polygenic contribution.