Quantitative genetics
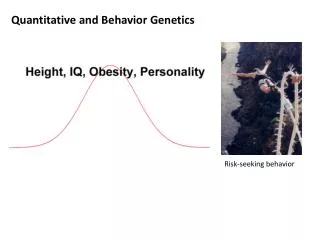
Quantitative genetics. Measuring Heritable Variation. The value of quantitative traits such a person’s height or fruit size or running speed is determined by their genes operating within their environment.

Quantitative genetics
E N D
Presentation Transcript
Measuring Heritable Variation • The value of quantitative traits such a person’s height or fruit size or running speed is determined by their genes operating within their environment. • The size someone grows is affected not only by the genes inherited from their parents, but the conditions under which they grow up.
Measuring Heritable Variation • For a given individual the value of its phenotype (P) (e.g. the weight of a tomato in grams) can be considered to consist of two parts -- the part due to genotype (G) and the part due to environment (E) • P = G + E. • G is the expected value of P for individuals with that genotype. Any difference between P and G is attributed to environmental effects.
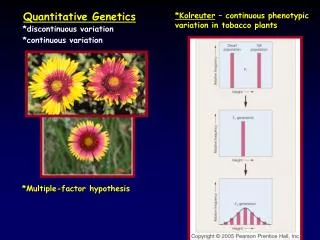
Measuring Heritable Variation • The quantitative genetics approach depends on taking a population view and tracking variation in phenotype and whether this variation has a genetic basis. • We measure variation in a sample using a statistical measure called the variance. The variance measures how different individuals are from the mean and the spread of the data. • FYI: Variance is the average squared deviation from the mean. Standard deviation is the square root of the variance.
We want to distinguish between heritable and nonheritable factors affecting the variation in phenotype. • It turns out that the variance of a sum of independent variables is equal to the sum of their individual variances. • Because P = G +E • Then Vp = Vg + Ve • where Vg is variance due to genotypic effects, Ve is variance due to environmental effects and Vp is phenotypic variation.
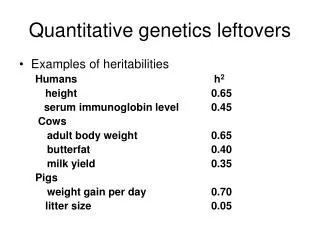
Measuring Heritable Variation • Heritability measures what fraction of variation is due to variation in genes and what fraction is due to variation in environment.
Measuring Heritable Variation • Heritability = Vg/Vp • Heritability = Vg/Vg+Ve • This is broad-sense heritability (H2). It defines the fraction of the total variance that is due to genetic causes. • Heritability is always a number between 0 and 1.
Measuring Heritable Variation • The genetic component of inheritance (Vg) includes the effect of all genes in the genotype. • If all gene effects combined additively then an individual’s genotypic value G could be represented as a simple sum of individual gene effects. • However, there are interactions among alleles (dominance effects) and interactions among different genes (epistatic effects).
Measuring Heritable Variation • To account for dominance and epistasis we break down the equation for P • P = G +E • G (genetic effects) is the sum of three components – A [additive component], D [dominance component] and I [epistatic or interaction component]. • G = A + D + I • So therefore P = A + D + I + E
Measuring Heritable Variation • Similarly, if we assume all the components of the equation P = A + D + I + E are independent of each other then the variance of this sum is equal to sum of the individual variances. • Vp = Va + Vd + Vi + Ve
Measuring Heritable Variation • Breaking down the variances allows us to produce a simple expression for how a phenotypic trait changes over time in response to selection. • Only one component Va is directly operated on by natural selection. • The reason for this is that the effects of Vd and Vi are strongly contextdependent i.e., their effects depend on what other alleles and genes are present (the genetic background).
Measuring Heritable Variation • Va however exerts the same effect regardless of the genetic background. Therefore, it’s effects are always visible to selection.
Measuring Heritable Variation • Remember we defined broad sense heritability (H2) as the proportion of total variance due to any form of genetic variation • H2 = Vg/Vg+Ve • We similarly define narrow sense heritability h2 as the proportion of variance due to additive genetic variation • h2 = Va/(Va + Vd + Vi + Ve)
Measuring Heritable Variation • Because narrow sense heritability is a measure of what fraction of the variation is visible to selection, it plays an important role in predicting how phenotypes will change over time as a result of natural selection. • Narrow sense heritability reflects the degree to which offspring resemble their parent in a population.
Estimating heritability from parents and offspring • Narrow sense heritability is the slope of a linear regression between the average phenotype of the two parents and the phenotype of the offspring. • Can assess the relationship using scatterplots.
Plot midparent value (average of the two parents) against offspring value.
If offspring don’t resemble parents then best fit line has a slope of approximately zero. • Slope of zero indicates most variation in individuals due to variation in environments.
If offspring strongly resemble parents then best fit line will be close to 1.
Most traits in most populations fall somewhere in the middle with offspring showing moderate resemblance to parents.
When estimating heritability important to remember parents and offspring share environment. • Need to make sure there is no correlation between environments experienced by parents and offspring. Requires cross-fostering experiments.
Smith and Dhondt (1980) • Smith and Dhondt (1980) studied heritability of beak size in Song Sparrows. • Moved eggs and young to nests of foster parents. Compared chicks beak dimensions to parents and foster parents.
Smith and Dhondt (1980) • Smith and Dhondt estimated heritability of bill depth about 0.98.
Berthold and Pullido study • Berthold and Pullido studied the heritability of migratory restlessness in European Blackcaps.
Berthold and Pullido estimated heritability of migratory restlessness as about 0.453.
Estimating heritability from twins • Monozygotic twins are genetically identical dizygotic are not. • Studies of twins can be used to assess relative contributions of genes and environment to traits.
McClearn et al.’s (1997) twin study • McClearn et al. (1997) used twin study to assess heritability of general cognitive ability. • Studied 110 pairs of monozygotic [“identical” twins i.e. derived from splitting of one egg] and 130 pairs of dizygotic twins in Sweden.
McClearn et al.’s (1997) twin study • All twins at least 80 years old, so plenty of time for environment to exert its influence. • However, monozygotic twins resembled each other much more than dizygotic. • Estimated heritability of trait at about 0.62.
Measuring differences in survival and reproduction • Heritable variation in quantitative traits is essential to Darwinian natural selection. • Also essential is that there are differences in survival and reproductive success among individuals. Need to be able to measure this.
Measuring differences in survival and reproduction • Need to be able to quantify difference between winners and losers in whatever trait we are interested in. This is strength of selection.
Measuring differences in survival and reproduction • If some animals in a population breed and others don’t and you compare mean values of some trait (say mass) for the breeders and the whole population, the difference between them (and one measure of the strength of selection) is the selection differential (S). • This term is derived from selective breeding trials.
Evolutionary response to selection • We want to be able to measure the effect of selection on a population. • This is called the Response to Selection and is defined as the difference between the mean trait value for the offspring generation and the mean trait value for the parental generation i.e. the change in trait value from one generation to the next.
Evolutionary response to selection • Knowing heritability and selection differential we can predict evolutionary response to selection (R). • Given by formula: R=h2S • R is predicted response to selection, h2 is heritability, S is selection differential.
Alpine skypilots and bumble bees • Alpine skypilot perennial wildflower found in the Rocky Mountains. • Populations at timberline and tundra differed in size. Tundra flowers about 12% larger in diameter. • Timberline flowers pollinated by many insects, but tundra only by bees. Bees known to be more attracted to larger flowers.
Alpine skypilots and bumble bees • Candace Galen (1996) wanted to know if selection by bumblebees was responsible for larger size flowers in tundra and, if so, how long it would take flowers to increase in size by 12%.
Alpine skypilots and bumble bees • First, Galen estimated heritability of flower size. Measured plants flowers, planted their seeds and (seven years later!) measured flowers of offspring. • Concluded 20-100% of variation in flower size was heritable (h2).