Download
1 / 23
230 likes | 330 Vues
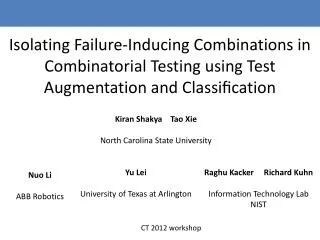
Isolating Failure-Inducing Combinations in Combinatorial Testing using Test Augmentation and Classification. Kiran Shakya Tao Xie North Carolina State University. Yu Lei University of Texas at Arlington. Raghu Kacker Richard Kuhn Information Technology Lab NIST. Nuo Li

E N D
Isolating Failure-Inducing Combinations in Combinatorial Testing using TestAugmentation and Classification KiranShakya Tao Xie North Carolina State University Yu Lei University of Texas at Arlington RaghuKacker Richard Kuhn Information Technology Lab NIST Nuo Li ABB Robotics CT 2012 workshop
Motivation • Software normally has faults. • Given a System Under Test (SUT) with N input parameters, a failure is usually caused by interaction among k parameters where k << N. • Problem: • Generating CT for even a small k (such as 5 or 6) is computationally expensive for SUT with large N. • CT results may be insufficient for diagnosis due to failures caused by interactions among 5 or more parameters (aka faulty combinations)
Background Previous Approach CT Suite Results Classification Failure Inducing Combination OurApproach CT Suite Results Classification Failure Inducing Combination Test Suite Augmentation Feature Selection
Problem • Often its hard to judge the size of faulty interactions. • Generating CT of higher strength is expensive. • Fault diagnosis on lower strength CT results may not be provide good results.
Agenda Problem Example Approach Proof of Concept Conclusion
Example • Consider TCAS v16 • # of Parameters: 12 • Total Input Space: 3 X 23 X 3 X 2 X 4 X 102 X 3 X 2 X 3 = 1036800 • Assume we don’t know in advance the nature of failures.
Example (continue..) Characteristic of Failure (TCAS v16)
Example (continue..) • Result of Classification Tree: • ( EMPTY ) • Reason: • Data Set is Highly Unbalanced. • Not enough Failing Tests.
Approach Labeled Test cases Test Execution Test Augmentation Faulty Combinations Combinatorial Tests Feature Selection Ranking Classification Model
Test Augmentation • Use OFOT 1 (one factor one time) method to generate additional tests from failing tests. • Ex: Given a Failing Test: 601,1,1,1,600,2,3,740,400,0,2,1 • OFOT generates • 300,1,1,1,600,2,3,740,400,0,2,1 • 299,1,1,1,600,2,3,740,400,0,2,1 • 601,0,1,1,600,2,3,740,400,0,2,1 • ….. 1. C. Nie and H. Leung, “The minimal failure-causing schema of combinatorial testing,” 2011.
Test Augmentation (continue..) • Maximum number of tests generated by OFOT is • where m is total no of failing tests, k is the number of parameters, and ai is distinct input values for each parameter. • This is far less than the number of tests required to build higher strength array. • For Example: 6-way Tests: 6,785 vs OFOT: 612
Test Augmentation (continue..) • Run the classification tree algorithm High_Confidence = 0: 0 (2248.0/12.0) High_Confidence = 1 | Alt_Layer_Value = 0 | | Own_Tracked_Alt_Rate = 600 | | | Cur_Vertical_Sep = 299: 0 (149.0/12.0) | | | Cur_Vertical_Sep = 300 | | | | Two_of_Three_Reports_Valid = 0: 0 (28.0/2.0) | | | | Two_of_Three_Reports_Valid = 1 | | | | | Other_RAC = 0 | | | | | | Other_Tracked_Alt = 1 | | | | | | | Other_Capability = 1: 1 (4.0) | | | | | | | Other_Capability = 2: 0 (3.0) | | | | | | Other_Tracked_Alt = 2: 1 (6.0) ...(and many more nodes)
Test Augmentation (continue..) Test Augmentation Result
Feature Selection • Can we do more? • Developers typically use classification tree to manually analyze the nature of faults • Clearly smaller the size of tree, easier will be the debugging process • For Example: • Classification tree generated for TCAS has 56 nodes • Can we reduce the size of classification tree?
Feature Selection (continue..) • Objective of Feature Selection • Identifying and removing irrelevant and redundant information as much as possible. • What kind of feature Selection: • Correlation based feature selection ( H.A.Mark, Ph.D.dissertation, Univ of Waikato, 1999.)
Ranking • For each leaf node that indicates a failure, a corresponding likely faulty combination is computed by • Taking the conjunction of the parameter values found in the path from the root node to the leaf node • Calculate its score A=1 Combination: A =1 and B=1 10/12 = .83 B=0 B=1 12/2 Output: Pass Output: Fail
Proof of Concept • Hypothesis: The faulty should show up higher in the rank. • Final Outcome: • TCAS v26, our approach did found the faulty combination. • TCAS v16, out of two combinations, our approach found one of them.
Proof of Concept Real Fault intalt_sep_test() { .... enabled=High_Confidence && /*(Own_Tracked_Alt_Rate<=OLEV) && BUG */ (Cur_Vertical_Sep>MAXALTDIFF); .... } HighConfidence=1&& OwnTrackedAltRate>OLEV(=600) && CurVerticalSep>MAXALTDIFF(=600)
Conclusion • Diagnosis of failure when the number of failures are low. • Our approach: • Tries to balance the test generation and classification for fault diagnosis • Proof of concept on two versions of TCAS
Thank you Questions?