Download
1 / 5
50 likes | 67 Vues
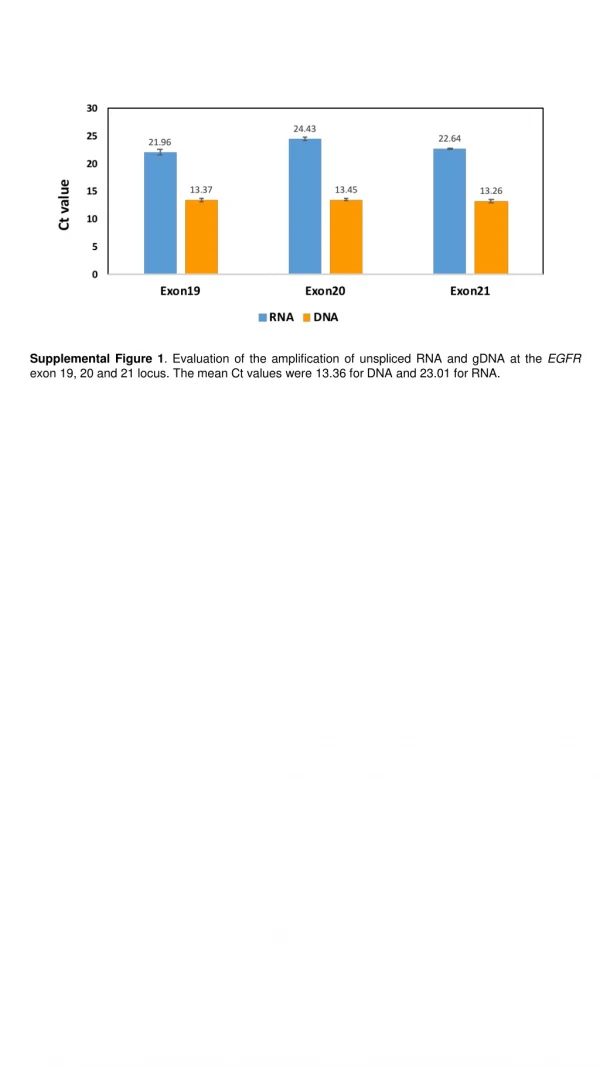
Analysis of the amplification of unspliced RNA and gDNA at the EGFR exon 19, 20, and 21 locus. The study includes evaluation of variant frequencies and coverage across different cells.

E N D
Supplemental Figure 1. Evaluation of the amplification of unspliced RNA and gDNA at the EGFR exon 19, 20 and 21 locus. The mean Ct values were 13.36 for DNA and 23.01 for RNA.
A Variant 1: Chr7:55242465:- (Exon19 del) Variant 2: Chr7:55259763:G Variant 3: Chr7:55249071:T (T790M) Variant 4: Chr7:55249063:A Variant 5: Chr7:55248926:C Variant 6: Chr7:55248787:C Variant 7: Chr7:55242782:C Variant 8: Chr7:55242609:G 4.5 3 4 3.5 B Variant 1: Chr7:55242465:- (Exon19 del) Variant 2: Chr7:55259763:G Variant 3: Chr7:55249071:T (T790M) Variant 4: Chr7:55249063:A Variant 5: Chr7:55248926:C Variant 6: Chr7:55248787:C Variant 7: Chr7:55242782:C Variant 8: Chr7:55242609:G C Variant 7: Chr7:55242782:C Variant 8: Chr7:55242609:G Variant 1: Chr7:55242465:- (Exon19 del) Supplemental Figure 2. (A) Mean allelic frequencies of variant 1 to variant 8 across different cells. Each column represents a cell and each row represents a variant. The blue, orange and red color panels represents cells from PC9 parental, G3 and G5 lines respectively. (B) The coverage of all the 8 variants detected in PC9 parental, G3 and G5 cells. The detected variants have similar coverage across different cells. (C) The average allelic frequencies of variant 1, exon19 deletion (present at H1), variant 7 and variant 8 (present at H2) across different cells in PC9 parental, G3 and G5 lines. These 3 variants were chosen to construct the haplotype because they were derived from the same PCR amplicon, hence eliminating any possible artifacts due to the differences in PCR efficiency of different amplicons.
Supplemental Figure 3. The expression level of selected genes (x-axis) in G3 and G5 lines. The y-axis represents the expression fold change in G3 and G5 lines against the PC9 parental line.
Chitale Rousseaux P=0.001422 P=2.266e-06 Directors Challenge Consortium LUAD TCGA P=0.02698 P=0.03298 Okayama Kohno P=0.002387 Supplemental Figure 4. Survival analysis in lung cancer patient cohorts for genes that are up-regulated in T790M+ cells (KDELC1, ZNF329, ZFC3H1, CREB3, KIF3C). X-axis represents time to event. Y-axis represents progression-free survival probability. The patients with high expression of these genes (red) have significantly poorer survival compared to patients with low expression (green). Numbers below the plots in green and red, respectively, are number of patients at risk. The number of individuals, the number of censored cases and the concordance index (CI) of each risk group are listed in the top-right inserts.
Supplemental Figure 5. The variant frequency of T790M mutation in the PC9 G3 and G5 bulk (blue) and single (orange) cells.