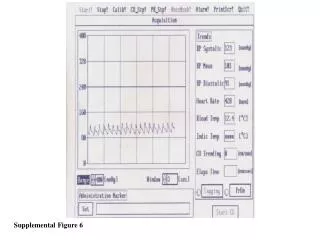
Figure 6 Voltage transient curve
10 likes | 167 Vues
Experimental study of a hydrogen fuel cell. Xu Yang, Linfeng Zhang Renewable Energy Research Laboratory Department of Electrical Engineering University of Bridgeport, Bridgeport, CT, 06604. INTRODUCTION

Figure 6 Voltage transient curve
E N D
Presentation Transcript
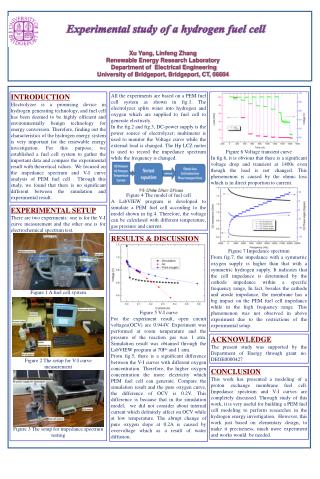
Experimental study of a hydrogen fuel cell Xu Yang, Linfeng Zhang Renewable Energy Research Laboratory Department of Electrical Engineering University of Bridgeport, Bridgeport, CT, 06604 INTRODUCTION Electrolyzer is a promising device in hydrogen generating technology, and fuel cell has been deemed to be highly efficient and environmentally benign technology for energy conversion. Therefore, finding out the characteristics of the hydrogen energy system is very important for the renewable energy investigation. For this purpose, we established a fuel cell system to gather the important data and compare the experimental result with theoretical values. We focused on the impedance spectrum and V-I curve analysis of PEM fuel cell . Through this study, we found that there is no significant different between the simulation and experimental result. All the experiments are based on a PEM fuel cell system as shown in fig.1. The electrolyzer splits water into hydrogen and oxygen which are supplied to fuel cell to generate electricity. In the fig.2 and fig.3, DC-power supply is the power source of electrolyzer; multimeter is used to monitor the Voltage curve while the external load is changed. The Hp LCZ meter is used to record the impedance spectrum while the frequency is changed. Figure 4 The model of fuel cell A LabVIEW program is developed to simulate a PEM fuel cell according to the model shown in fig.4. Therefore, the voltage can be calculated with different temperature, gas pressure and current. Figure 6 Voltage transient curve In fig.6, it is obvious that there is a significant voltage drop and transient at 1400s even though the load is not changed. This phenomenon is caused by the ohmic loss which is in direct proportion to current. Figure 7 Impedance spectrum From fig.7, the impedance with a symmetric oxygen supply is higher than that with a symmetric hydrogen supply. It indicates that the cell impedance is determined by the cathode impedance within a specific frequency range, In fact, besides the cathode and anode impedance, the membrane has a big impact on the PEM fuel cell impedance while in the high frequency range. This phenomenon was not observed in above experiment due to the restrictions of the experimental setup. EXPERIMENTAL SETUP There are two experiments: one is for the V-I curve measurement and the other one is for electrochemical spectrum test. Figure 1 A fuel cell system Figure 2 The setup for V-I curve measurement Figure 3 The setup for impedance spectrum testing RESULTS & DISCUSSION Figure 5 V-I curve For the experiment result, open circuit voltages(OCV) are 0.944V. Experiment was performed at room temperature and the pressure of the reaction gas was 1 atm. Simulation result was obtained through the LabVIEW program at 70Fo and 1 atm. From fig.5, there is a significant difference between the V-I curves with different oxygen concentration. Therefore, the higher oxygen concentration the more electricity which PEM fuel cell can generate. Compare the simulation result and the pure oxygen curve, the difference of OCV is 0.2V. This difference is because that in the simulation model, we did not consider about internal current which definitely affect on OCV while at low temperature. The abrupt change of pure oxygen slope at 0.2A is caused by overvoltage which as a result of water diffusion. ACKNOWLEDGE The present study was supported by the Department of Energy through grant no. DEOE0000427 CONCLUSION This work has presented a modeling of a proton exchange membrane fuel cell. Impedance spectrum and V-I curves are completely discussed. Through study of this work, it is very useful for building a PEM fuel cell modeling to perform researches in the hydrogen energy investigation. However, this work just based on elementary design, to make it preciseness, much more experiment and works would be needed.