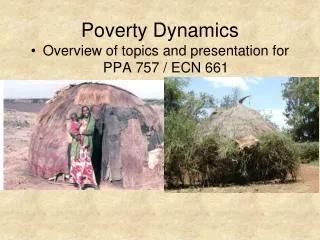
Poverty Dynamics
Poverty Dynamics. Overview of topics and presentation for PAI 757 / ECN 661. 2008 Game Play, Karare Kenya, Index Based Livestock Insurance Project. What is poverty?. If we want to reduce it, first we have to define what it is. How do we measure poverty?

Poverty Dynamics
E N D
Presentation Transcript
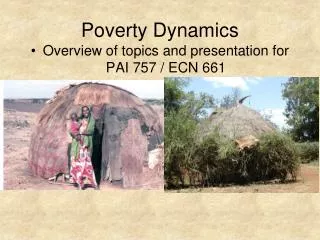
Poverty Dynamics • Overview of topics and presentation for PAI757 / ECN 661
2008 Game Play, Karare Kenya, Index Based Livestock Insurance Project
What is poverty? • If we want to reduce it, first we have to define what it is. • How do we measure poverty? • Do different measures tell us different things? • Do these different messages have different policy implications?
Spatial dimensions • Poverty reduction funding related to the poverty incidence in a PM constituency. • DFiD project bases number eligible for cash transfers on incidence in the location. • Note some areas left off the map as no survey was run
Dynamic measures of poverty • Krishna’s study. • 35 villages in five districts of Rajasthan. • Stages of progress exercise to establish what constitutes poverty in each village. • First four stages: buying food to eat, sending children to school, possessing clothes to wear outside the house, retiring debt in regular installments. • Poverty is not being able to meet these four conditions.
Dynamic measures of poverty • Select event prior to the study period • 25 years ago (the national emergency). • Discuss each household’s position at the time of the event and current position (ended up excluding education due to changes over time in the view of education). • Men and women draw up different lists, reconcile at end, and follow up with households if outstanding differences exist.
Dynamic measures of poverty • Falling into poverty • No single factor, mostly a combination of factors. Not a single blow, but a series of blows. • 85% of cases involve some combination of health problems and health related expenses, high interest private debt, and social and customary expenses. • Drunkenness and laziness are mentioned in around 5% of cases.
Dynamic measures of poverty • Escaping poverty. • Diversification of income sources – taking up activities in addition to agriculture. • Often an urban link and information is critical. • Personal capability and enterprise, relatives help. • Direct assistance from government departments, NGOs, political parties less important. • Informal sector is main source of opportunities, not formal full time employment.
Recent paper has similar findings 2006 study, Andhra Pradesh, 36 villages, World Development 34(2): 271-288
Dynamic measures of poverty Krishna, World Development , 35(11): page 1951. 2007
Dynamic measures of poverty • Policy implications? • First, if we want to help people escape, we should first know what they do themselves. • Second, if we want to help people avoid falling into poverty, we should understand the main factors that lead to a fall and target them.
Dynamic measures of poverty • From the Rajasthan study: • High healthcare costs, high interest consumption debt, social expenses on deaths and marriage. • Escaping poverty can be improved by improved information (water tables for irrigation, disease control for health, contacts and jobs in the city).
Principal reasons for falling into poverty Ibid. Page 1953. Can add to more then 100% as combinations possible
Principal means of escaping poverty Ibid. page 1954
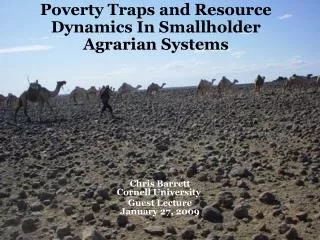
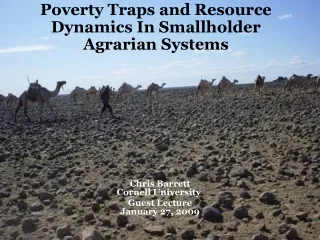
In pastoral areas, the key asset is livestock. This makes asset poverty simpler to analyze than in other settings, but there is broad applicability of this approach
The Basic Idea • is Income for household i at time t • is a vector of productive assets for hh i , time t • is the rate of return on these productive assets, possibly as a function of asset levels. • is the household and period specific shock to the return on assets. • are household specific but time invariant income flows • is household and time specific transitory income • is household and time specific measurement error. • From Barrett et al. (2006) JDS paper. • Transfers such as Ui could raise income, impact future asset stocks, influence the rate of return to existing assets • Assets could be subject to stochastic shocks, say , with theta and gamma defined over the interval [0,1].
Research Design for Work in East Africa • IBLI is asset protection, reduce impact of shocks to A. • HNSP is cash transfer, works like U. • Sites with IBLI (Index Based Livestock Insurance) and HSNP (Hunger Safety Net Program) • Sites with only IBLI or HSNP • Sites with neither • Full comparison is ahead
What is the Index Part? Normal Year (May 2007) Drought Year (May 2009) From Chantarat and Mude 2011
Asset poverty can be viewed as “structural poverty”. • the assets of a household are below a threshold that generates expected income above some defined poverty line. • Another issue is that the returns to assets are potentially a function of asset levels • Income poverty can be viewed as “transitory poverty”. • The observed income level is below a threshold in a given time period. • Vulnerability to these different types of poverty differs.
Average household income is highly variable over time periods. • Clear seasonality (1 is the long rains, 3 is the short rains, 2 and 4 are dry seasons). • Slow upward shift of the cycle.
Clearly, this is a highly variable production environment due to rainfall fluctuations. Contrast households by income variability over time under the assumption that higher variability is “bad”. CV of household income is a decreasing function of both average herd size and of average income level
Herd dynamics play a critical role in household vulnerability. • Average household herd size (the asset) changed dramatically over time (35% increase to max, 55% decrease from max). • The late 1996 loss to the average herd corresponds to a 34% drop in expected income.
Regression analysis allows us to trace out the relationship between herd size per adult equivalent and expected income. • Threshold using a $0.50 per person per day poverty line: • wet season 6.5 animals • dry season 9.5 animals
Contrast Asset and Income HC index When you measure and how you measure poverty leads to different implications (income poor at $0.50 line)
When you measure and how you measure poverty leads to different implications (11 sites in Kenya and Ethiopia)
Evidence from the Borana Plateau Threshold around 10 animals per person (also note this is close to the dry season asset poverty line) This pattern suggests restocking should be targeted at people around the threshold.
Poverty and Vulnerability linked • What do people say they are worried about when you ask them? • Risk rankings from the PARIMA survey. • Developed list of common concerns through open ended work. • “which of these you are afraid could affect your household in the coming three months”. • Allowed them to say “not a concern” and they could add others as well.
The implications for development policy • Vulnerability to poverty may influence behavior as much as the state of poverty. • Asset complementarities may be critical (and wealth may matter). Land plus irrigation as opposed to just land. • Access to assets – who has access? Will markets alone allocate assets to allow people to climb out of poverty?
Conclusion • Different static measures have different advantages and disadvantages. • Applying a variety of them to the same data set helps. • Spatial analysis can help targeting of policy efforts.
Conclusion • Dynamic measures provide different types of information on poverty. • What do people identify as the causes of falling into poverty? • What do people identify as the main paths out of poverty? • What can government / NGOs do with this information? • Policy to prevent falls (“safety nets”) may differ from policy to allow escape (“cargo nets”). • Humanitarian is by nature targeted at transitory, crisis relief. Does this crowd out longer term development assistance?
Conclusion • Asset based poverty measures differ from income based poverty measures. • Asset vulnerability may be important. • Seasonality of income measures may be misleading.