Download
1 / 23
230 likes | 382 Vues
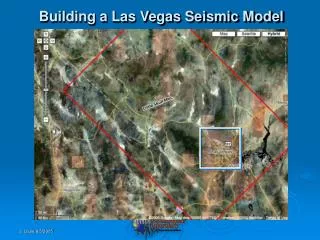
IMPROVING CONSISTENCY BETWEEN TRANSIT PATH-BUILDING AND MODE CHOICE IN LAS VEGAS. David Kurth, Suzanne Childress, & Sathya Thyagaraj Parsons. Motivation for Project. Regional Fixed Guideway Alternatives Analysis / New Starts Existing, unused mode choice model 2002 on-board survey data

E N D
IMPROVING CONSISTENCY BETWEEN TRANSIT PATH-BUILDING AND MODE CHOICE IN LAS VEGAS David Kurth, Suzanne Childress, & Sathya Thyagaraj Parsons 11th TRB National Transportation Planning Applications Conference – Session 18
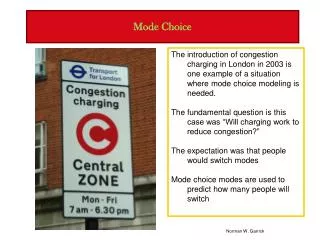
Motivation for Project • Regional Fixed Guideway Alternatives Analysis / New Starts • Existing, unused mode choice model • 2002 on-board survey data • FTA transit forecasting guidelines • Consistency between path-building & mode choice • “Tell a coherent story” 11th TRB National Transportation Planning Applications Conference – Session 18
2002 Transit Network • 49 routes (2002-04) • Basic grid system • ½ to 1 mile spacing • Routes by service type: • Local 42 • Limited stop 6 • Express 1 • 24 hr/day routes: 16/49 • Emphasize coverage over frequency; routes with: • 0-20 minute hdwy: 9 • 30-45 minute hdwy: 23 • 60 minute headway: 17 11th TRB National Transportation Planning Applications Conference – Session 18
2002 Transit Access Mode 11th TRB National Transportation Planning Applications Conference – Session 18
2002 Resident Transit Shares |–- Home-Based Work –-| 11th TRB National Transportation Planning Applications Conference – Session 18
2002 Visitor Transit Shares 11th TRB National Transportation Planning Applications Conference – Session 18
Surveyed Boardings 11th TRB National Transportation Planning Applications Conference – Session 18
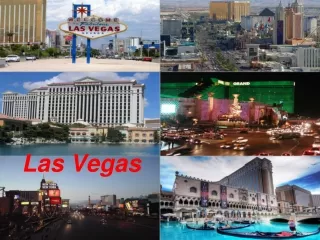
Who Rides Where? • Fares • Non-Strip – $1.25 • Strip – $2.00 • Speeds (MPH) • Non-Strip – 12-18 • Strip – 5-8 • Strip Boardings • 44% of all visitor • 15% of all resident 11th TRB National Transportation Planning Applications Conference – Session 18
Conclusions from On-Board Survey Data • Walk access reigns (at least in 2002) • Resident mode shares as expected • HBW low income captivity • Discernible visitor mode shares • Exceed 10% of total boardings • Low transfer rates 11th TRB National Transportation Planning Applications Conference – Session 18
Resident Mode Choice Models 11th TRB National Transportation Planning Applications Conference – Session 18
Visitor Mode Choice Models 11th TRB National Transportation Planning Applications Conference – Session 18
Mode Choice Coefficient Relationships 11th TRB National Transportation Planning Applications Conference – Session 18
The Issues • Mode choice model • Different travel market segments • Different model forms • Path-builder consistency • Different travel market segments 11th TRB National Transportation Planning Applications Conference – Session 18
Transit Path-Building • TRANSCAD “Path-Builder” Method • Based on weighted time paths • Weights ≈ mode choice parameters • Vary by peak & off-peak, trip purpose, income group • Path Sets 1 – HBW low incomes 2 – HBW upper incomes 3 – HBO 4 – NHB & Visitor Low Value-of-Time 5 – Visitor High Value-of-Time 11th TRB National Transportation Planning Applications Conference – Session 18
Transit Path-Building 11th TRB National Transportation Planning Applications Conference – Session 18
Transit Path-Building 11th TRB National Transportation Planning Applications Conference – Session 18
Path Set 3 Home-Based Non-Work Low Value-of-Time Off-Peak Network Local Only Network- includes only Local Routes No Express, BRT, Premium Routes, or Monorail Path Set 5 Hotel-Based Convention/ Business, Gaming, & Non-Hotel-Based High Value-of-Time Off-Peak Network Local Only Network- includes only Local Routes No Express, BRT, Premium Routes, or Monorail Impact of Path Sets on Path-Building Example 11th TRB National Transportation Planning Applications Conference – Session 18
Path-building Weights (Reminder) 11th TRB National Transportation Planning Applications Conference – Session 18
In-Vehicle Travel Time Comparison 11th TRB National Transportation Planning Applications Conference – Session 18
PS 3 – PS 5 IVTT Zero Difference Excluded IVTT Difference in Minutes 11th TRB National Transportation Planning Applications Conference – Session 18
Example Paths O T Set 5 Path 2 Local Buses Set 3 Path 3 Local Buses T D T 11th TRB National Transportation Planning Applications Conference – Session 18
Choice of Path 11th TRB National Transportation Planning Applications Conference – Session 18
So What? • Improved path-building / mode choice consistency is possible • Increases path-building complexity • Can produce different paths / impedances • Importance increases for • Premium alternatives • Fare differences 11th TRB National Transportation Planning Applications Conference – Session 18