Download
1 / 16
160 likes | 178 Vues
This engineering experiment conducted on September 23, 1998 explores the drying rate and moisture content of sand in a drying furnace. The experiment involved adding water to dry sand, placing it in the furnace, and measuring the drying rate and flux. The results and conclusions are discussed.

E N D
Drying Furnace Experiment September 23,1998Engineering 435 By Michael McGann & Michael Hobbs
Outline • Introduction • Background and Theory • Procedure • Results • Conclusions • Summary
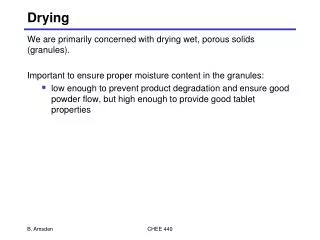
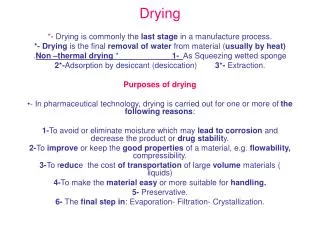
Introduction • Drying furnace experiment • H2O added to dry sand • Cake pan placed in furnace • Determined drying rate(g/min) • Determined flux(g/min/cm2) • Raw data produced drying curves
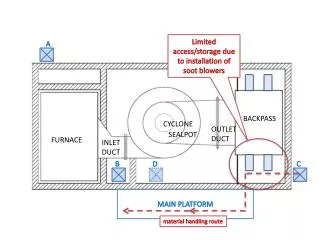
Background and Theory Drying Furnace Schematic Heat in Moist air out Dry air in
Background and Theory(cont.) Pan Location Schematic Pan 3 Pan 4 Pan 1 Pan 7 Pan 2 Pan 6 Pan 8 Pan 5
Background and Theory(cont.) • Heat transfer principles • Mass transfer principles • Electronic data acquisition • Drying furnace systems in McCabe,Smith, & Harriot
Procedure • Measured Dry sand and H2O • Placed in drying furnace for duration of time • Raw data acquired from strain gage electronically • End time, measured D weight
Results • Linear drying rate in region observed • Results on Table1 • Strain gage conversion on Table 2 • Figure 1, Strain gage conversion curve • Figure2, Drying History/Drying Rate Curve
Total Moisture Content Drying Rate
Conclusions • Electronic data confidence level at 95% • Drying rates concurred with theory • Short drying time limited information • Different drying rates at different locales • Air flow uneven throughout dryer
Summary • Constant-rate period observed • Short drying times limited observations • Different samples dried at different rates due to location within dryer.