Download
1 / 29
290 likes | 338 Vues
Explore the virtual surface method for simulating water drops on surfaces, based on fluid dynamics and contact angle models. Understand factors like surface tension, viscosity, and contact angle hysteresis affecting water behavior on different scales. Dive into the results and analysis of capillary action, drop impacts, and more. Discover the computational complexity and future work areas with octree data structures and distributed computing.

E N D
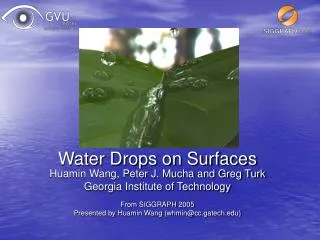
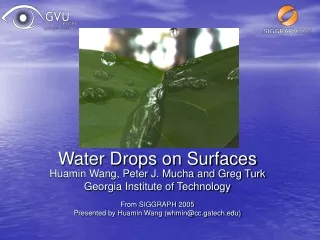
Water Drops on Surfaces Huamin Wang, Peter J. Mucha and Greg Turk Georgia Institute of Technology From SIGGRAPH 2005 Presented by Huamin Wang (whmin@cc.gatech.edu)
Motivation Film special effects
Motivation Scientific Visualization
Motivation Game industry (eventually)
Motivation Game industry (eventually)
Overview • Background • The virtual surface method • Dynamic contact angle model • Results and Analysis • Future work
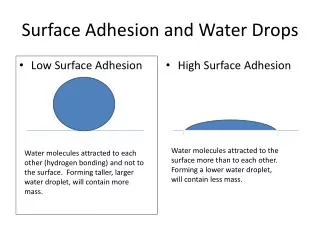
Background Small-scale liquid-solid Interactions Q: Why small water behaves naturally different from large water? A1: Surface Tension (water: 72 dynes/cm at 25º C). A2: Viscosity (water: 1.0020 × 10⁻³ N·s/m2 at 20º C). Lake view ( >1 meter) Water drops (in millimeters)
Background • To calculate surface tension force: : Tension coefficient (always positive) : Mean curvature : Normal (always pointing outward) (Laplace’s Law) Uniform curvature Water sphere: photo taken on the International Space Station. Courtesy NASA
Background Stable contact angle satisfies Young’s Relation:
Background • Our work is based on fluid simulation using Computational Fluid Dynamics (CFD). • Solve the Navier-Stokes equations for the velocity field • Use the particle Level-Set method
Overview • Background • The virtual surface method • Dynamic contact angle model • Results and Analysis • Future work
The virtual surface method • Solution: • Place a virtual surface beneath the solid plane • Estimate the surface tension using the new combined surface • Problem: • Real World: a stable contact front with contact angle • Simulation: Curvature at contact front is positive, thus always pushes inward: Air Liquid Virtual Liquid Solid Virtual Surface
The virtual surface method • Create a virtual surface • Estimate curvature on the contact front • A kink cause the curvature to “push” the fluid front Air Air Liquid Virtual Liquid Solid Virtual Liquid Solid Virtual Surface Virtual Surface Advancing to right Receding to left
The virtual surface method Details? Please read our paper.
Overview • Background • The virtual surface method • Dynamic contact angle model • Results and Analysis • Future work
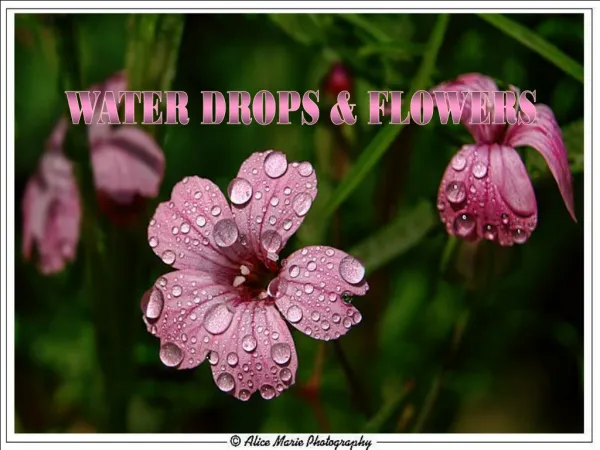
Dynamic contact angle model Contact angle hysteresis: Small water drops can stay on a vertical plane, while large water drops will flow down.
Dynamic contact angle model • Stable contact angles bounds: • Advancing • Receding • a valid stable contact angle: • Final pressure P is: Pa: pressure calculated using Pr: pressure calculated using
Dynamic contact angle model • Dry/Wet conditions • wetting history map • Contact angles based on surface wetness (wet advancing angle smaller than the dry advancing angle) Dusted region is dry, transparent region is wet.
Overview • Background • The virtual surface method • Dynamic contact angle model • Results and Analysis • Future work
Results and Analysis • Physics phenomena: Capillary Action
Results and Analysis • Drop impacts, rivulets, dripping drops, and more…
Results and Analysis • Drop impacts, rivulets, dripping drops, and more…
Results and Analysis • Video (playback speed 10 times slower than real world speed)
Results and Analysis • Grid resolution: 400×400×400 • Simulation speed: 20 minutes per frame • Each sequence has 500 frames • The total running time is: 20 × 500 / (60 × 24) ≈7 days
Results and Analysis • Why is it relatively computational expensive? • High grid solution (400×400×400) • Large viscosity effects • Implicit Euler method • The condition number of the linear system increased.
Overview • Background • The virtual surface method • Dynamic contact angle model • Results and Analysis • Future work
Future Work • Octree data structure • Virtual surface reconstruction based on particles • Distributed computing
Acknowledgements We would like to thank: • Mark Carlson, Chris Wojtan, Howard Zhou, Spencer Reynolds, Nathan Sisterson • Everyone supporting our work, including reviewers. • Gatech Computational Perception Laboratory, Geometry Group • CMU graphics lab Funded: • In part by NSF grant DMS 0204309. Rendering : • Physically Based Ray tracer (pbrt), Matt Pharr & Greg Humpheys • Light Probe Image Gallery, Paul Debevec
Fin Any questions? Water Drops on Surfaces Huamin Wang, Peter J. Mucha and Greg Turk Georgia Institute of Technology From SIGGRAPH 2005 Presented by Huamin Wang (whmin@cc.gatech.edu)