Download
1 / 80
800 likes | 822 Vues
Water Quality Monitoring Program and Baseline Results. OMSAP Technical Meeting September 22, 1999 Carlton D. Hunt & P. Scott Libby Battelle Duxbury Operations Duxbury, MA 02332. Acknowledgements.

E N D
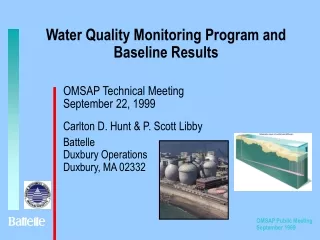
Water Quality Monitoring Program and Baseline Results OMSAP Technical Meeting September 22, 1999 Carlton D. Hunt & P. Scott Libby Battelle Duxbury Operations Duxbury, MA 02332
Acknowledgements • Numerous scientists, regulators, and citizens from the New England area have contributed to the design, implementation, interpretation and understanding of water quality in the Massachusetts Bay system • Siting studies • Research • Monitoring • Products of this work are included in over 20 major water quality reports available from MWRA at http://www.mwra.state.ma.us/harbor/enquad/trlist.htmand numerous peer reviewed publications
Concerns Inflow Outflow Human Health Contaminants Bacteria Viruses Bioaccumulation Ecological Nutrients Contaminants Organic Material Food Chain Community Structure Living Resources ATMOSPHERE Light GasExchange WATER COLUMN N2, |O2, CO2 Mammals Planktivorous Fish Sources Rivers Boundary Nonpoint Effluents Piscivorous Fish Phytoplankton Dissolved Zooplankton Demersal Fish Microbes Particulate Detritus Regeneration Epibenthos Microbes N, P, Si, O2, CO2 SEDIMENT Infauna
Presentation Summary • Overview • Water Quality Monitoring Program • Major Baseline Characteristics • Spatial and Temporal Responses • Nutrients • Chlorophyll • Dissolved Oxygen • Plankton • Thresholds • Future expectations
Water Quality Monitoring Introduction WQ monitoring program objectives are to determine if changes occur in the nearfield (local) or farfield (regional) to • Nutrients, dissolved oxygen, or phytoplankton biomass • Phytoplankton and zooplankton community composition in the nearfield and farfield occur • Phytoplankton production rates in the water column near the outfall and outer Boston Harbor
Water Quality Monitoring Overview • Nutrients, chlorophyll, and dissolved oxygen • Harbor signatures and gradients in Mass Bay • Plankton communities • Thresholds and detection of change • Expectations of conditions after the outfall begins discharging at the Massachusetts Bay location This presentation focuses on spatial and temporal responses in the following areas
MWRA Monitors 21 Nearfield and 28 Farfield Water Quality Stations in Massachusetts Bay Water Quality Measurement Program
Water Quality Monitoring Vertical profiles • Continuous vertical hydrographic profiles to within 5 m of the bottom • Temperature • Salinity • Dissolved oxygen • Chlorophyll fluorescence • Beam attenuation (particles) • Irradiance (light) • Discrete samples from 3 or 5 depths (depending on water depth)
Water Quality Monitoring Data evaluation Response to weather (wind and rain) Light fields Hydrographic Plankton responses Primary production Nutrients Chlorophyll biomass Species composition Nuisance species Phytoplankton Zooplankton Species composition Dissolved Oxygen Production /Respiration To understand spatial and temporal trends and causal relationships
Water Quality Baseline Characteristics • Gradients (nutrients, biomass, and dissolved oxygen) • Temporal • Offshore • Vertical • Tidal exchange and export from Boston Harbor • Plankton Communities • Phytoplankton • Zooplankton
Water Quality Gradients • Gradients in the system are examined using • horizontal contours • vertical sections • temporal plots • individual stations • regions in the Bay
Water Quality Horizontal Gradients • The gradient offshore of Boston Harbor and along the shore from the Harbor to Plymouth is a persistent feature in the surface waters under the present discharge regime.
Water Quality Horizontal GradientsJune 1998 Storm Response Surface Salinity
Water Quality Harbor Gradient after Secondary Treatment - NH4
Water Quality Harbor Gradient after secondary treatment - NH4
Water Quality Vertical GradientsBoston to GOM Transect - Salinity
Water Quality Vertical GradientsBoston to GOM Transect - Temperature
Water Quality Vertical GradientsBoston to GOM Transect - DIN
Water Quality Vertical GradientsBoston to GOM Transect - Silicate
Water Quality Vertical GradientsBoston to GOM Transect - Chlorophyll
Water Quality Vertical GradientsBoston to GOM Transect - Dissolved Oxygen
Water Quality Summary Vertical & Horizontal Gradients Water column is well mixed over the winter Increasing temperature and runoff in early spring initiates stratification Spring/summer temperature differences intensify stratification Stratification remains until fall overturn (due to lower vertical temp gradient and increased storm activity) Return to winter conditions in early winter
Water Quality Summary Vertical & Horizontal Gradients • Boston Harbor is localized source of nutrients • Sewage effluent comprises 90% of the land source nutrients added to Boston Harbor (Kelly 1997) • Strong inshore/offshore nutrient gradient away from Harbor in surface waters • Gradients are less distinct in the bottom waters • Seasonal nutrients cycle (stratification) • Upwelling and winds may be a factor in bringing nutrients to surface waters in the summer
Water Quality Harbor/Nearfield Exchange A strong physical front is evident off the mouth of Boston Harbor Front analysis
Water Quality Harbor/Nearfield Exchange outfall outfall
Water Quality Harbor/Nearfield Exchange From Kelly 1997 0.6 - 0.8 N2 23-25 TN (11-12 DIN) 6.6 TN (4.5 DIN) ~15 TN (5.2-6.6 DIN) 0.2 TN 1.7 DIN Units are in 105 kmols/yr Baseline Period Post-Discharge Period <0.6 - 0.8 N2 Freshwater 0.8 TN 12-16 TN (2.5-3.9 DIN) Ocean exchange 100% of the nutrients from the Deer Island outfall will be exported into Massachusetts Bay in the future <0.2 TN <1.7 DIN Ocean exchange dominates the nutrients mass balance in Boston Harbor 85% of the nutrients from the Deer Island outfall are currently exported into Massachusetts Bay
Water Quality Summary Harbor Exchange • Effluent from Deer Island outfall presently enters Massachusetts Bay • Exchange of Boston Harbor waters with nearfield and coastal waters results in a plume of Harbor water extending southward along the coast in western Massachusetts Bay • Harbor plume is primarily in the western nearfield surface waters and coastal waters to the south
Water Quality Regional Responses • Stations in six regions are examined for temporal and spatial responses • Boston Harbor • Coastal • Nearfield • Cape Cod Bay • Boundary with Gulf of Maine • Offshore (south and east of the nearfield)
Water Quality Chlorophyll • An indicator of phytoplankton biomass • Key measurement and indicator in the water quality program • Temporal and regional distribution are variable • Responds to light and nutrient fields (see Keller et al. Poster) • Summer surface water nutrient limitation • Winter light limitation • Influenced by weather and storm events • Results in a generally consistent seasonal progression • Maximum values are in the pycnocline during stratification and in the waters of the western nearfield and outer Boston Harbor
Water Quality Chlorophyll Distribution • Seasonal peaks are observed in the spring, summer, and fall • Classic winter/spring bloom does not always occur • Frequently observe a major fall boom • Large sustained bloom occurred in the winter/spring of 1999 following a late winter bloom in December 1998 Asterionellopsis glacialis Phaeocystis pouchetii Phaeocystis pouchetii
Water Quality Nearfield Chlorophyll - Fall Blooms 1993 1995 1998
Water Quality Nearfield Chlorophyll - Spring Blooms 1992 1994 1996
Water Quality Nearfield Chlorophyll Winter Bloom 1998-1999 Nearfield Chlorophyll 1998 - 1999 Satellite imagery suggests chlorophyll levels in the surface waters of Massachusetts Bay remained elevated between mid-Dec 1998 and early February 1999
Water Quality Chlorophyll Summary • Spring bloom not as consistent as conventional wisdom would suggest • Fall bloom appears to be a consistent event • having occurred in 5 of 7 years • Elevated summer concentrations observed in Nearfield (98 & 99)
Water Quality Dissolved Oxygen • Degradation of particulate organic matter (POM) • water column • deposited POM in sediments • Other factors • duration and strength of stratification • bottom water temperature • initial DO concentration at onset stratification • downwelling/intrusion events Many factors affect dissolved oxygen levels in the water
Water Quality Dissolved Oxygen • Mean DO in bottom waters has exceeded the caution level once • 1999 may have an exceedance in September or October