Redox States and Phosphorylation Potentials
730 likes | 1.01k Vues
Redox States and Phosphorylation Potentials. Bob Harris raharris@iupui.edu October 5, 2010. Redox States. NAD + /NADH cytoplasm NAD + /NADH mitochondria NADP + /NADPH cytoplasm NADP + /NADPH mitochondria. Measuring the NAD + redox state. Usually expressed as ratio of [NAD +] /[NADH]

Redox States and Phosphorylation Potentials
E N D
Presentation Transcript
Redox States and Phosphorylation Potentials Bob Harris raharris@iupui.edu October 5, 2010
Redox States • NAD+/NADH cytoplasm • NAD+/NADH mitochondria • NADP+/NADPH cytoplasm • NADP+/NADPH mitochondria
Measuring the NAD+ redox state • Usually expressed as ratio of [NAD+]/[NADH] • Total NAD+ divided by total NADH? • Free NAD+ divided by free NADH? • Make any difference if we use total values or free values?
Cytosolic NAD+/NADH ratios based on total (free and bound) NAD+ and NADH in rat liver StateNAD+NADHNAD+/NADH mol/g Fed 0.76 0.14 5.4 Starved 0.82 0.16 5.1
Cytosolic NAD+/NADH ratios based on free concentrations StateNAD+/NADH Fed 725 Starved 528
Calculating the NAD+ redox state Free values obtained by measuring metabolites of an equilibrium enzyme Lactate + NAD+ pyruvate + NADH+ H+ Keq = [pyruvate][NADH][H+] / [lactate][NAD+] [NAD+]/[NADH] = [pyruvate][H+] / [lactate] x 1/Keq
Equilibrium constants • Equilbrium constants: for A B; Keq = [B]/[A] • Mass action ratios: MAR = [B]/[A] • Equilibrium enzymes:high activity; Keq = MAR • Nonequilibrium enzymes:low activity; Keq= MAR A B C D E F
Cytoplasmic free NAD+/NADH Lactate dehydrogenase catalyzes equilibrium reaction: Lactate + NAD+ pyruvate + NADH+ H+ Keq = [pyruvate][NADH][H+] / [lactate][NAD+] [NAD+]/[NADH] = [pyruvate][H+] / [lactate] x Keq Set pH = 7.0 and incorporate into Keq K’eq = [pyruvate][NADH]/ [lactate][NAD+] [NAD+]/[NADH] = [pyruvate]/[lactate] x 1/K’eq
Example of calculation Freeze clamp liver of fed wild type mice: Lactate: 1.09 0.09 mol/g wet wt Pyruvate: 0.12 0.01 mol/g wet wt K’eq @ pH 7.0 = 1.11 x 10⁻⁴ [NAD+]/[NADH] = [pyruvate]/[lactate] x 1/K’eq [NAD+]/[NADH] = [0.120]/[1.09] x 1/1.11 x 10-4 [NAD+]/[NADH] = 991
Effect of ethanol on liver cytosolic NAD+/NADH ratio Ethanol + NAD+ acetaldehyde + NADH + H+ Expect NADH drive pyruvate to lactate via: Pyruvate + NADH +H+ Lactate + NAD+ Expect decrease in NAD+/NADH ratio
Effect of ethanol on liver cytosolic NAD/NADH ratio TreatmentNAD/NADH Control 719 Ethanol (2 millimoles) 132* *Five minutes after injection of ethanol.
Equilibrium enzymes used for calculations of free ratios Mitochondrial free NAD+/NADH: -hydroxybutyrate dehydrogenase -hydroxybutyrate + NAD+ acetoacetate + NADH + H+ K’eq @ pH 7.0 = 4.93 x 10⁻² Glutamate dehydrogenase Glutamate + NAD+ yields -ketoglutarate + NADH + NH4+ K’eq @ pH 7.0 = 3.87 x 10⁻³ mM
Effect of starvation on liver mitochondrial NAD+ redox state StateNAD+/NADHNAD+/NADH (Free)* (Total) Fed 7.3 2.2 Starved 4.7 ND *Calculated from concentrations of components of the glutamate dehydrogenase reaction.
Effect of ethanol on liver mitochondrial NAD/NADH ratio Ethanol + NAD+ acetaldehyde + NADH + H+ Acetaldehyde + NAD+ acetate + NADH + H+ Expect NADH will drive -ketoglutarate to glutamate via: -Ketoglutarate + NADH +NH4+ glutamate + NAD+ Expect decrease in mitochondrial NAD+/NADH ratio
Effect of ethanol on liver mitochondrial NAD+/NADH ratio TreatmentNAD+/NADH Control 7.7 Ethanol (2 millimoles) 2.7* *Five minutes after injection of ethanol.
Equilibrium enzymes used for calculations of free ratios Cytoplasmic free NADP+/NADPH 6-phosphogluconate dehydrogenase: 6-phosphogluconate + NADP+ ribulose 5- phosphate + NADPH + H+ + CO2 Isocitrate dehydrogenase: Isocitrate + NADP+ -ketoglutarate + NADPH + CO2 Malic enzyme: Malate + NADP+ pyruvate + NADPH + H+ + CO2
Keq for NADP+ coupled enzymes 6-phosphogluconate dehydrogenase 1.17 M Isocitrate dehydrogenase 1.72 x 10⁻¹ M Malic enzyme 3.44 x 10⁻² M
Reactions catalyzed by NADP+ coupled enzymes produce CO2 CO2 concentration does not vary significantly under conditions that are normally studied. Rather than measure, usually assumed to be 1.16 mM. Caution: CO2 concentration is affected by changes in pH.
Typical values of cytoplasmic NADP+/NADPH StateNADP+/NADPHNADPH/NADP+ Fed 0.009 110 Starved 0.006 175
NADP+/NADPH ratio important • Sets the ratio of GSH/GSSG in cytoplasm because of equilibrium enzyme reaction catalyzed by glutathione reductase NADPH + H+ +GSSG 2 GSH + NADP+ • Driven far to the right because of very high NADPH/NADP+ ratio. • Important in both cytoplasm and mitochondrial matrix space
NAD+/NADH ratio important for many reasons • High cytoplasmic NAD/NADH ratio favors oxidation of substrates. • Low cytoplasmic NAD/NADH results in low pyruvate and low oxaloacetate which inhibits glucose synthesis. • Free NAD+ is activator of SIRT1 • Free NADH is activator of the PDKs • Both serve as both substrates and allosteric effectors for many enzyme systems.
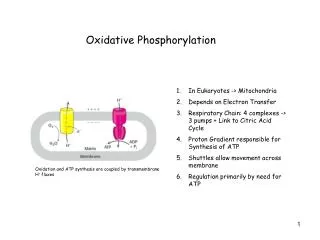
Phosphorylation potential • Defined as [ATP]/[ADP][Pi] • Comes from:∆G = ∆Gº - RTln[ATP]/[ADP][Pi] • Two ways of determining • From measurements of total ATP, ADP, and Pi (not accurate because total [ADP] >>free [ADP]) • From concentrations of metabolites of equilibrium enzymes (much more accurate)
Calculation of phosphorylation potentials [ATP]/[ADP][Pi] = [NAD+]/[NADH] x [glyceraldehyde-3-P]/[3-phosphoglycerate] x KGAPDH x KPGK
Derivation Glyceraldehyde-3-P + NAD+ + Pi yields 1,3- bis-Phosphoglycerate + NADH + H+ 1,3-Phosphoglycerate + ADP yields 3-Phosphoglycerate + ATP Sum: Glyceraldehyde-3-P + NAD+ + Pi + ADP yields 3-phosphoglycerate + ATP + NADH KGAPDH x K3-PGK = [ATP]/[ADP][Pi] x [NADH]/[NAD+] x 3-[phosphoglycerate]/ [glyceraldehyde-3-P] [ATP]/[ADP][Pi] = [NAD+]/[NADH] x [glyceraldehyde-3-P]/[3-phosphoglycerate] x KGAPDH x K3-PGK
Calculation of phosphorylation potentials [ATP]/[ADP][Pi] = [NAD+]/[NADH][H+] x [glyceraldehyde-3-P]/[3-phosphoglycerate] x KGAPDH x K3-PGK Obtain [NAD+]/[NADH] from [pyruvate]/[lactate] and KLDH [ATP]/[ADP][Pi] = [pyruvate]/[lactate] x [glyceraldehyde-3-P]/[3-phosphoglycerate] x {KGAPDH x K3-PGK}/KLDH
Calculation of phosphorylation potentials Obtain [glyceraldehyde-3-P] from [dihydroxyacetone-P] and the Keq (22) for triose phosphate isomerase glyceraldehyde-3-P dihydroxyacetone-P Keq = 22 = [dihydroxyacetone-P]/ [glyceraldehyde-3-P] [glyceraldehyde-3-P] = [dihydroxyacetone-P]/22
Calculation of phosphorylation potentials [ATP]/[ADP][Pi] = [pyruvate]/[lactate] x [dihydroxyacetone phosphate]/22 x 1/[3-phosphoglycerate] x {KGAPDH x K3-PGK}/KLDH {KGAPDH x K3-PGK}/KLDH =1.65 x 10⁷ M-1
Typical metabolite values for freeze clamped rat liver Metabolitemol/g wet wt Lactate 1.36 Pyruvate 0.258 3-Phosphglycerate 0.387 Dihydroxyacetone P 0.043 ATP 3.38 ADP 1.32 AMP 0.294 Pi 4.76
Calculation of phosphorylation potentials ATPADPATP/ADPxPi* mol/g wet wt M-1 Total 3.38 1.32 531 Free 16,300 *[Pi] taken to be 4.8 mol/g
Calculation of free [ADP] Free cytosolic [ADP] = [ATP]/{[Pi] x phosphorylation potential}
Calculation of phosphorylation potentials ATPADPATP/ADPxPi* mol/g M-1 Total 3.38 1.32 531 Free 3.38 0.046 16,300 *[Pi] taken to be 4.8 mol/g; water content taken to be 0.8 grams per gram wet weight tissue.
Calculation of free [AMP] From the equilibrium constant (1.05) for reaction catalyzed by myokinase: ATP + AMP 2 ADP Free cytosolic [AMP] = {[free cytosolic ADP]2 x KMK}/[measured ATP]
Comparison of total measured [AMP] and calculated free [AMP] ADPAMP mol/g wet wt Total 1.32 0.294 Free cytosolic 0.046 0.0007* *0.7 nmoles/g wet weight!
Important points about adenine nucleotides • Free [AMP] is much lower than total [AMP] - Important because [AMP] activates AMPK and functions as positive or negative allosteric effector for many enzymes. • Free [ADP] is much lower than the total [ADP] • Important because [ADP] determines respiration rate of mitochondria • Decrease in [ATP] results in increase in [AMP] because of equilibrium reaction catalyzed by myokinase: 2 ADP ATP + AMP
Effect of fasting, exercise, hypoglycemia, high fat diet, and diabetes on liver adenine nucleotides Berglund et al. JCI 119:2412–2422 (2009)
Hems and Brosnan. Effect of ischemia on content of metabolites in rat liver and kidneyBiochem J 1970; 120:105-111 Well-fed rats IschemiaATPADPAMPAMP/ATP (sec) (mol/g wet wt) 0 2.7 1.3 0.26 0.09 60 1.6 1.8 0.85 0.53 48-starved rats IschemiaATPADPAMPAMP/ATP (sec) (mol/g wet wt) 0 1.7 2.0 0.64 0.37 60 0.9 1.7 1.65 1.83
Greenbaum et al. Hepatic metabolites and …. in animals of different dietary and hormonal status. Arch. Biochem. Biophys. 1971; 143: 617-663 Metabolic State ATPADPAMPAMP/ATP (mol/g wet wt) Well-fed 1.9 0.91 0.23 0.12 Starved 1.7 1.0 0.31 0.18
Schewenke et al. Mitochondrial and cytosolic AT/ADP ratios in rat liver in vivo Biochem J 1981; 200: 405-408 Metabolic State ATPADPAMPAMP/ATP (mol/g dry wt) Well-fed 3.3 0.86 0.16 0.05 Starved 2.7 0.82 0.18 0.07
Our measurements on fed and fasted mice Measurement FedFasted mol/g wet wt ATP 3.0 0.2 3.2 0.2 ADP 0.89 0.07 0.85 0.07 AMP 0.28 0.04 0.24 0.03
Why difference between our data and the data of Burgess et al.? • Freeze clamping has to be done rapidly to preserve phosphorylation state of the adenine nucleotides. • Burgess et al. Approximately 20 seconds. • Our study: Less than 8 seconds.
Faupel et al. The problem of tissue sampling from experimental animals….. ABB 1972; 148: 509-522
Faupel et al. The problem of tissue sampling from experimen-tal animals…. ABB 1972; 148: 509-522
Freeze clamp protocol • Three people who can work together are required. One to manage stop watch; one strong person to handle freeze clamps; one person with good hands to kill mouse by cervical dislocation, open mouse with a single cut with scissors, tear out liver, and place on freeze clamp. • Practice until steps 4, 5, and 6 can be completed by team in less than 8 seconds. Discard any samples not clamped in less than 8 seconds. 3. Handle mice on several days prior to the experiment in the room in which the mice will be killed. Transport the mice to the killing room one at a time. 4. Person 1: start stopwatch at time of cervical dislocation; stop at time liver clamped. 5. Person 2: kill mouse by cervical dislocation with large pair of scissors; open mouse with a single cut with same scissors; tear out liver by hand; place liver on freeze clamps. 6. Person 3: clamp tissue with as much force as possible with liquid-nitrogen cooled clamps. 7. Clean the area and instruments before bringing the next mouse to the killing room. (Mice are stressed by the odor of blood).
Effect of fasting, exercise, hypoglycemia, high fat diet, and diabetes on liver adenine nucleotides Berglund et al. JCI 119:2412–2422 (2009)
Our measurements on chow and high fat fed mice Measurement ChowHigh Fat Diet mol/g wet wt ATP 3.0 0.2 2.7 0.2 ADP 0.89 0.07 1.14 0.05* AMP 0.28 0.04 0.42 0.02* *P < 0.05
Best way to measure ATP, ADP, and AMP? • Enzyme-coupled assays? • HPLC?
Direct comparison of enzymatic and HPLC method for nucleotide quantification Measurement EnzymaticHPLC mol/g wet wt ATP 3.0 0.2 2.7 0.2 ADP 0.89 0.07 1.8 0.1* AMP 0.28 0.04 0.6 0.1* *P < 0.05
References Faupel, RP, Seitz, HJ, Tarnowski, W., Thiermann, V, Weiss, C. The problem of tissue sampling from experimental animals with respect to freezing technique, anoxia, stress and narcosis. ABB (1972) 148: 509-522. Veech, RL, Guynn, R, Veloso, D. The time-course of the effects of ethanol on the redox and phosphorylation states of rat liver. Biochem. J. (1972) 127, 387-397. Veech, RL, Lawson, JWR, Cornell, NW, Krebs, HA. Cytosolic phosphorylation potential. JBC (1979) 254: 6538-6547. Berglund,ED, Lee-Young, RS, Lustig, DG, Lynes, SE, Donahue,P, Camacho, RC., Meredith, ME., Magnuson, MA, Charron, MJ, Wasserman, DH. Hepatic energy state is regulated by glucagon receptor signaling in mice. JCI (2009) 119: 2412-2422.