Download

1 / 96
990 likes | 1.43k Vues
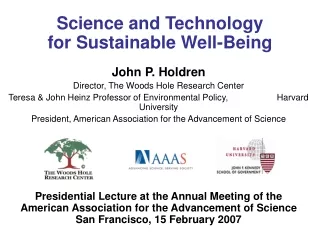
Science and Technology for Sustainable Well-Being. John P. Holdren Director, The Woods Hole Research Center Teresa & John Heinz Professor of Environmental Policy, Harvard University President, American Association for the Advancement of Science

E N D
Science and Technology for Sustainable Well-Being John P. Holdren Director, The Woods Hole Research Center Teresa & John Heinz Professor of Environmental Policy, Harvard University President, American Association for the Advancement of Science Presidential Lecture at the Annual Meeting of the American Association for the Advancement of Science San Francisco, 15 February 2007
It is clear that the future course of history will be determined by the rates at which people breed and die, by the rapidity with which nonrenewable resources are consumed, by the extent and speed with which agricultural production can be improved, by the rate at which the under-developed areas can industrialize, by the rapidity with which we are able to develop new resources, as well as by the extent to which we succeed in avoiding future wars. All of these factors are interlocked. Harrison Brown (1917-1986), The Challenge of Man’s Future,1954 My pre-occupation with the great problems at the intersection of science and technology with the human condition – and with the interconnectedness of these problems with each other – began when I read The Challenge of Man’s Future in high school. I later worked with Harrison Brown at Caltech.
I had the great good fortune to work with several other giants in the study and practice of science-society interactions who have now passed on. Harvey Brooks Gilbert White Joseph Rotblat Jerry Wiesner Roger Revelle
The next generation of giants in interdisciplinary “public interest science” is still with us. I learned much from those pictured here. Dick Garwin Lew Branscomb Paul Ehrlich George Woodwell Murray Gell-Mann
A number of my predecessors in the presidency of the AAAS have likewise focused their efforts particularly on the intersection of science and technology with the problems of sustainable well-being that I will be discussing tonight. Gil Omenn Peter Raven Shirley Ann Jackson Jane Lubchenco
The AAAS is itself not about science in isolation, but about science in society.
Foundations of human well-being Human well-being rests on a foundation of three pillars, the preservation & enhancement of all 3 of which constitute the core responsibilities of society: • economic conditions and processes such as employment, income, wealth, markets, trade, productive technologies… • sociopolitical conditions and processes such as law & order, national & homeland security, governance, justice, education, health care, science, culture & the arts, liberty, privacy… • environmental conditions and processes such as air, water, soils, mineral resources, the biota, nutrient cycles, climatic processes…
Foundations (continued) • Arguments about which one of the three pillars is “most important” are pointless. • Each of the three is indispensable. Failure in any one of them means collapse of the human enterprise (the metaphor of the three-legged stool). • The three interact. The economic system cannot function without inputs from the environmental system, nor can it function without elements of societal stability provided by the sociopolitical system. And societal stability itself cannot be maintained in the face of environmental disaster, as Katrina and New Orleans demonstrated is true even in the most economically prosperous country in the world.
My definitions • Development means improving the human condition in all its aspects, not only economic but also sociopolitical and environmental. • Sustainable development means doing so by means and to end points that are consistent with maintaining the improved conditions indefinitely. • Sustainable well-being implies pursuing sustainable development to achieve well-being where it is absent and putting the maintenance & expansion of well-being onto a sustainable basis where it is being provided unsustainably today.
Impediments to sustainable well-being • persistence of poverty & preventable disease • impoverishment of the environment • pervasiveness of armed conflict • oppression of human rights • wastage of human potential
Factors driving or aggravating the impediments • Non-use, ineffective use, and misuse of science and technology • Maldistribution of consumption and investment • Incompetence, mismanagement, and corruption • Continuing population growth • Ignorance, apathy, and denial
Contributors to global mortality in 2000Millions of Years of Life Lost (WHO, World Health Report 2002) • childhood & maternal malnutrition 200 • high blood pressure, cholesterol, over- weight, low physical activity 150 • unsafe sex 80 • tobacco 50 • unsafe water 50 • war & revolution, 20th century avg 40 • indoor smoke from solid fuels 35 • alcohol 30 • urban air pollution 6 • climate change 5
Contributors to global mortality in 2000Millions of Years of Life Lost (WHO, World Health Report 2002) • childhood & maternal malnutrition (POVERTY) 200 • high blood pressure, cholesterol, overweight, low physical activity (CONSUMPTION) 150 • unsafe sex (IGNORANCE, DENIAL) 80 • tobacco (IGNORANCE, DENIAL) 50 • unsafe water (POVERTY) 50 • war & revolution, 20th century avg (CONFLICT) 40 • indoor smoke from solid fuels (TECHNOLOGY) 35 • alcohol (IGNORANCE, DENIAL) 30 • urban air pollution (CONSUMPTION, TECHNOLOGY) 6 • climate change (CONSUMPTION, TECHNOLOGY, DENIAL)
S&T for sustainable well-being:What can they contribute? • Science: • improving understanding of threats & possibilities • enabling advances in technology • Technology: • driving economic growth via new products & services, reduced costs, increased productivity • reducing resource use & environmental impacts • S&T: • integrated assessment of options • advice to decision-makers & the public about costs, benefits, dangers, uncertainties • S&T education toward a more S&T-literate society
S&T for sustainable well-being:Four key challenges • Meeting the basic needs of the poor • Managing the competition for land, soil, water, and the net primary productivity of the planet • Mastering the energy-economy-environment dilemma • Moving toward a nuclear-weapon-free world
Meeting the basic needs of the poor:The UN Millennium Development Goals
The test of our progress is not whether we add more to the abundance of those who have much; it is whether we provide enough for those who have too little. Franklin D. Roosevelt Second Inaugural Address, 1937
TARGET: Halve, between 1990 and 2015, the proportion of people living on less than $1/day and the proportion of people suffering from hunger.
TARGET: Reduce by 2/3, between 1990 and 2015, the under-5 mortality rate.
Survival curve in sub-Saharan Africa resembles that of 1840s England UNDP Human Development Report 2005
TARGET: Reduce by 3/4, between 1990 and 2015, the maternal mortality rate
TARGET: By 2015 have halted and begun to reverse the spread of HIV aids and the incidence of malaria and other major diseases.
Effective technologies need not be complicated UNDP Human Development Report 2006
Total Official Development Assistance is to all developing countries. LDCs = Least Developed Countries
The United States is the second stingiest of OECD nations in Official Development Assistance as a percentage of our GDP.
Managing the competition for land, soil, water, and the net primary productivity of the planet
Competing human uses for the land, soil, water, and NPP of the Earth • land for housing, commerce, industry, and transport infrastructure • land, soil, water, and net primary productivity for production of food, forage, fiber, biofuels, chemical feedstocks • land, water, & biota for recreation, beauty, solace of unspoiled nature, and ecosystem functions
Key ecosystem functions • regulation of water flows • purification/detoxification of soil, water, air • nutrient cycling • soil formation • controls on pests & pathogens • pollination of flowers & crops • biodiversity maintenance • climate regulation (evapotranspiration, reflectivity) • carbon sequestration
Challenges to managing the competition among these uses • pressure of rising population & affluence • rising tide of toxic spillovers from agriculture, industry, energy supply • disruption of global & regional climate by greenhouse gases from fossil-fuel combustion • haphazard, unintegrated, and short-range planning • frequent failure to charge a price for destroying environmental resources and services
The competition for fresh water:Where’s the water and where is it going? cubic kilometers Water in the oceans 1,400,000,000 Water locked up in ice 30,000,000 Ground water 10,000,000 Water in lakes & rivers 100,000 cubic kilometers per year Precipitation on land 120,000 Evaporation from land 70,000 River runoff & groundwater recharge 50,000 Available river flow & recharge* 12,000 Withdrawals for human use 5,000 World desalting capacity 13 * = runoff + recharge – uncaptured storm runoff – remote areas
Key numbers for water demand cubic kilometersper year Global withdrawals for human use 5,000 of which agriculture 3,500 …industry 1,000 …domestic 500 of which drinking water 5 …bottled water 0.17 cubic meters per person per year Global average withdrawals per person 800 Nigeria… 50 Israel… 300 China… 500 Mexico… 800 Italy… 1,000 United States…2,000
The geography of water stress UNDP Human Development Report 2006
Sinking aquifers: the case of Mexico UNDP Human Development Report 2006
The competition for land Croplands & pasture-lands now cover ~40% of world land area. Forest area has declined by ~10 million km2 (about 20%) in the last 300 years, with most of the loss in the last 50. Desert & near-desert land has increased by nearly as much. Cities, roads, & airports now cover 2% of world land. Foley et al., SCIENCE 309, 2005
Deforestation for soy growing in the state of Mato Grosso, Brazil Moutinho and Schwartzman, 2005
Percentage of species threatened with extinction Chapin et al., 2000
Comparing past, present, and future extinction rates Millennium Ecosystem Assessment 2005
Mastering the energy-economy-environment dilemma
The essence of the dilemma • Reliable and affordable energy is essential for meeting basic human needs and fueling economic growth. • But many of the most difficult and dangerous environmental problems at every level of economic development arise from the harvesting, transport, processing, & conversion of energy.
Energy supply is the source of… • most indoor and outdoor air pollution • most radioactive waste • much of the hydrocarbon and trace-metal pollution of soil and ground water • essentially all of the oil added by humans to the seas • most of the human-caused emissions of greenhouse gases that are altering the global climate. After four decades of studying these issues, I’ve concluded that energy is the core of the environment problem, environment is the core of the energy problem, and resolving the energy-economy-environment dilemma is the core of the problem of sustainable well-being for industrial & developing countries alike.
History of world supply of primary energy Hydro+ means hydropower plus other renewables besides biomass Energy supply grew 20-fold between 1850 and 2000. Fossil fuels supplied 80% of the world’s energy in 2000.
About 1/3 of primary energy supply is used to generate electricity Shares of nuclear, natural gas, & coal growing, those of oil & hydro shrinking. USA gets 50% of its electricity from coal, China gets 80% from coal.
Particulate pollution in selected cities OECD Environmental data 1995; WRI China tables 1995; Central Pollution Control Board, Delhi. “Ambient Air Quality Status and Statistics, 1993 and 1994”; Urban Air Pollution in Megacities of the World, WHO/UNEP, 1992; EPA, AIRS database.
But indoor particulate pollution is much worseIndoor & outdoor exposure to total suspended particulate matter (TSP) worldwide, 1996 Average TSP Percent of world Concentration population exposure (ug/m3) (% of person-hr-ug/m3) ------------------- ------------------------------- indoor outdoor indoor outdoor -------- ---------- --------- ----------- Industrialized urban 100 70 7 1 rural 80 40 2 0 Developing urban 250 280 25 9 rural 400 70 52 5 85% of global particulate exposure is from indoor air! Kirk R. Smith, pers. comm., 1999
Business-as-usual (BAU) forecasts to 2030 2004 2030 Primary energy, exajoules World 500 750 United States 107 150 China 73 140 Electricity, trillion kWh World 16.5 30 United States 4.0 6.0 China 1.9 4.8
Under continuation of BAU • World use of primary energy reaches 2.5 times the 2000 level by 2050 and 4 times the 2000 level by 2100. • World electricity generation reaches 3 times the 2000 level by 2050 and 5 times the 2000 level by 2100.