Download
1 / 1

E N D
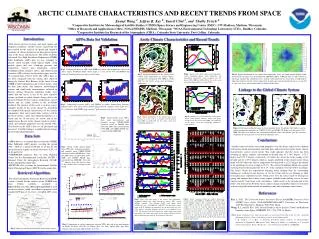
With broad spectral coverage and high spatial and temporal resolutions, satellite sensors can provide the data needed for the analysis of spatial and temporal variations of climate parameters in data-sparse regions such as the Arctic and Antarctic. The newly available Advanced Very High Resolution Radiometer AVHRR Polar Pathfinder (APP) data set was extended to include cloud fraction, cloud optical depth, cloud particle phase and size, cloud-top pressure and temperature, surface skin temperature, surface broadband albedo, radiative fluxes, and cloud forcing (hereafter APP-x dataset) for the polar regions over the 19-yr period from 1982 to 2000. The APP-x data set has been compared with the surface data collected during the Surface Heat Balance of the Arctic Ocean (SHEBA) field experiment in the western Arctic, with the data from Arctic and Antarctic meteorological stations and cloud radar measurements collected in Barrow, Alaska. Numerous modeling studies have shown that the Arctic is one of the most sensitive regions on Earth to global climate change due to the positive feedback between surface temperature, surface albedo, and ice extent, known as the ice-albedo feedback. The purpose of this work is to draw a more complete picture of the Arctic climate by describing the temporal and spatial characteristics of the climate components. First and second order statistics will be given for surface, cloud, and radiation properties as a whole and for 18 sub-areas, by season and in the annual mean. Recent Arctic climate trends in surface, cloud, and radiation properties over the period 1982-2000 based on the APP-x data set are presented and discussed. Possible linkages to global climate change are investigated preliminarily. • APP-x data set, a extended data set from the AVHRR Polar Pathfinder (APP) project, covering the period 1982 - 2000 at a spatial resolution of 25 km for the Arctic/Antarctic regions on local solar times (LST) of 14:00 and 04:00. • NCEP/NCAR reanalysis data set from National Center for the Environmental Prediction (NCEP) / National Center for Atmospheric Research (NCAR) for the atmospheric profile data. • ISCCP D2 data set from the International Satellite Cloud Climatology Project (ISCCP) for the ozone data. • The Cloud and Surface Parameter Retrieval (CASPR) system, a toolkit for the analysis of the AVHRR data from NOAA satellites, (available at http://stratus.ssec.wisc.edu/caspr/caspr.html) is used to retrieve surface, cloud, and radiative properties with standard APP data set to create a extended APP-x data set. APPX RADAR CERES-TEAM APPX RADAR CERES-TEAM ARCTIC CLIMATE CHARACTERISTICS AND RECENT TRENDS FROM SPACE Xuanji Wang 1, Jeffrey R. Key 2, Taneil Uttal 3, and Shelby Frisch 4 1Cooperative Institute for Meteorological Satellite Studies (CIMSS)/Space Science and Engineering Center (SSEC), UW-Madison, Madison, Wisconsin; 2Office of Research and Applications (ORA), NOAA/NESDIS, Madison, Wisconsin; 3NOAA Environmental Technology Laboratory (ETL), Boulder, Colorado; 4Cooperative Institute for Research of the Atmosphere (CIRA), Colorado State University, Fort Collins, Colorado. Introduction APP-x Data Set Validation Arctic Climate Characteristics and Recent Trends Fig.2. Comparisons between APP-x and SHEBA in surface skin temperature (above left) and in surface broadband albedo (above right) in a 25 x 25 km2 box with SHEBA ship centered. Cloud fraction is also shown at the bottom. Fig.8. Annual cycles of the surface skin temperature, surface broadband albedo, cloud temperature and atmospheric precipitable water averaged over the period 1982–2000 on 14:00 LST for the Arctic ocean and surrounding landmasses north of 60oN. Fig.7. Spatial distribution of the annual mean surface skin temperatures in Celsius degree averaged over the period 1982–2000 on 14:00 LSTfor the Arctic ocean and surrounding landmasses. Fig.13. Spatial distribution of the surface skin temperature (Left) and cloud fraction (Right) trends for the Arctic in winter over the period 1982-2000 from APP-x 14:00 LST data set. The contours in the image stand for the confidence levels, and the colors represent the trend values as indicated by right-side color bars for the surface temperature in degree per year and cloud fraction on a scale of 0 to 1 per year. Areas with cooling trends are marked with dashes. Linkage to the Global Climate System Fig.3. Comparisons between APP-x and SHEBA in surface downwelling shortwave radiation (above left) and in surface downwelling longwave radiation (above right) over a 25 x 25 km2 box with SHEBA ship centered. Cloud fraction is also shown at the bottom. Fig.10. Annual cycles of cloud fraction, cloud optical depth, cloud particle effective radius and phase averaged over the period 1982–2000 on 14:00 LST for the Arctic ocean and surrounding landmasses north of 60oN. Fig.9. Spatial distribution of the annual mean cloud fractionon a scale of 0 to 1 averaged over the period 1982–2000 on 14:00 LST for the Arctic ocean and surrounding landmasses. Fig.4. Cloud fraction from APP-x data, radar measurements, and monthly average CERES-TEAM retrievals based on MODIS data. Note that APP-x data calculated from 1998-2000, and CERES TEAM data calculated from 2000-2003. Fig.14. Correlation coefficient images between monthly Arctic Oscillation (AO) indices and the surface temperature anomalies on 14:00 LST (Left) and 04:00 LST (Right) over the period 1982–2000. The color scale indicates the correlation coefficient values; the contours give the statistical confidence levels in percent (%) based on the Student’s T test. Data Sets Conclusions Satellite retrieved surface and cloud properties over the Arctic region were validated with surface-based measurements and radar data, and used to investigate Arctic climate characteristics and its recent trends. This study indicates that the Arctic has been warming in spring, summer, and autumn at decadal rates of 1.16oC degree , 0.72oC degree and 0.74oC degree, respectively. In winter the Arctic has been cooling at the decadal rate of -0.35oC degree, which is mainly attributed to the central Arctic Ocean north of 80oN where the surface temperature has decreased at -2.2oC degree per decade at the confidence level of as high as 99.7%. The surface broadband albedo also signals warming trend at the decadal rate of -3.1% at the confidence level of 98.8% in autumn. The Arctic Ocean has experienced warming much stronger than the surrounding landmasses, resulting in the decrease of sea ice extent and sea ice thinning as other researchers have reported recently. Cloud cover over the Arctic tends to be larger in spring and summer due to more water vapour available from melting sea ice or water vapour transfer from large scale circulations, which needs to be investigated in the future. The interactions between Arctic climate change and global climate system need to be investigated further in both of modeling study and continuous observations. Fig.5. Cloud visible optical depth from APP-x data, radar measurements, and monthly mean CERES-TEAM retrievals based on MODIS data. Note that APP-x data calculated from 1998-2000, and CERES TEAM data calculated from 2000-2003. Note that “*” indicates that radar had less than 15 days of data due to outages in that month. Retrieval Algorithm References Fig.12. Arctic sub-areal trends in surface temperature averaged over 1982–2000 on 14:00 LST for winter (DJF), spring (MAM), summer (JJA), autumn (SON), and annual mean (ANN) from the top to bottom panels in order. The number on the top of each bar represents the statistical confidence level in percent (%). The Area IDs representing the Arctic sub-areas from 1 to 18 labeled on the horizontal coordinate, i.e. X axis, are given in Fig.1, and the Area IDs from 19 to 21 stand for the Arctic Ocean north of 60oN, the Arctic Landmasses north of 60oN, and the Arctic region north of 60oN, respectively. Fig.11. Time series and trends of the surface skin temperature, broadband albedo, and cloud fraction in winter (DJF), spring (MAM), summer (JJA), autumn (SON), and annual mean (ANNUAL) over 1982-2000 on 14:00 LST for the Arctic region north of 60oN. Numbers in parentheses are the trend slope per year (“S”) with its standard deviation and the F test confidence level (“P”). The first pair of S and P denotes the surface temperature trend (green line), the second pair stands for the surface albedo (red line), and the third pair represents the cloud fraction (blue line). Key, J., 2002: The Cloud and Surface Parameter Retrieval (CASPR) System for Polar AVHRR User’s Guide. NOAA/NESDIS/ORA/ASPT, University of Wisconsin, 1225 West Dayton St., Madison, WI 53562, 68 pp. Wang, X.J., and J.R. Key, 2003: Recent Trends in Arctic Surface, Cloud, and Radiation Properties from Space, SCIENCE, 299, 1725-1728, 14 March. *Note: Some of photos were taken by people not associated with this work. See the copyright information below. None of the photos can be used commercially. 1: K. Claffey; 2: J. Key; 3: Feenicks Polarbear Image Gallery; 4: Photographer unknown; 5: Thomas D. Mangelsen, from "Images of Nature" (a calendar); 6: Copyright Corel Corporation, From "The Arctic", a Corel Professional Photos CDROM. * 1 2 3 4 4 5 3 6 Fig.6. Comparisons in surface temperature between APP-x data and in-situ measurements in Eureka (88.05ºN, 86.42ºW) for Winter (Dec, Jan, Feb), Spring (Mar, Apr, May), Summer (Jun, Jul, Aug) and Fall (Sept, Oct, Nov). Fig.1. Study area and the division of the entire Arctic region.