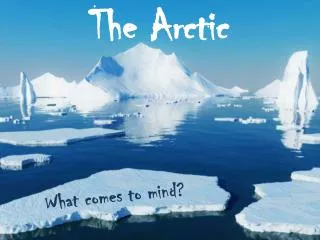
The Arctic Climate
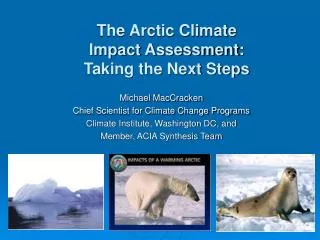
This presentation, delivered by Paquita Zuidema at RSMAS/MPO, explores significant changes in the Arctic climate, including temperature anomalies, sea ice thickness, and the impact of permafrost and cloudiness over several decades. Key observations from Alaska and Greenland are discussed, alongside model projections for future scenarios up to 2100. The data highlights the critical rise in sea levels and emphasizes the urgent need for scientific action. Stay informed with resources from renowned Arctic research websites for real-time data and historical information.
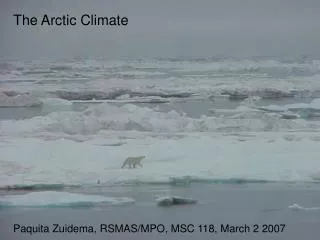

The Arctic Climate
E N D
Presentation Transcript
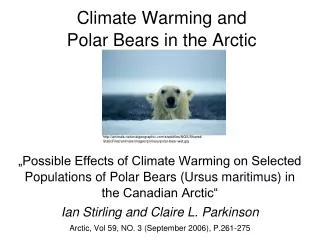
The Arctic Climate Paquita Zuidema, RSMAS/MPO, MSC 118, March 2 2007
Changes of Alaskan station temperatures (F), 1949-2004[ from Alaska Climate Research Center ]
Submarine- measured sea ice thickness
Cumulativevolume changes of glaciers (ACIA, 2005)North AmericaScandinaviaRussiaNo. Hemis.
Satellite data tells us sea-level heights, since 1992 a rise of about 2 cm
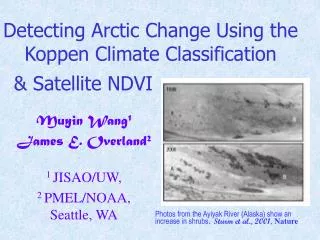
spring Increased Spring And Summer Cloudiness summer 1982-1999 AVHRR data (Wang&Key, 2003) annual Persistent springtime cloud cover may advance snowmelt onset date (e.g., modeling study of Zhang 1996)
Permafrost (CCSM) Sept. sea-ice (CCSM) Sept. sea-ice (Observed) (Holland, Lawrence)
IPCC models: Projected Arctic (60-90ºN) change of surface air temperature relative to 1980-2000
Impact of 1 meter (3 feet) sea level rise on FL
Surface Heat Budget of the Arctic SHEBA
Early May ~ 76N, 165 W
spring Increased Spring And Summer Cloudiness summer 1982-1999 AVHRR data (Wang&Key, 2003) annual Persistent springtime cloud cover may advance snowmelt onset date (e.g., modeling study of Zhang 1996)
Surface-based Instrumentation: May 1-8 time series 8 dBZ -20 -45 -5 6 35 GHzcloudradar ice cloud properties km 4 2 depolarization lidar-determined liquid cloud base Microwave radiometer-derived liquid water paths 100 g/m^2 2 3 4 5 6 7 8 1 day day 4X daily soundings.Near-surface T ~ -20 C, inversion T ~-10 C 1 4 lidar cloud base 8 z -30C -10C
May 4 Cloud Particle Imager data …pristine ice particles from upper cloud ...super-cooled drizzle
Jnoon = 60o Clouds decrease surface SW by 55 W m-2 ,increase LW by 49 W m-2 How do clouds impact the surface ? Surface albedo=0.86; most SW reflected back Clouds warm the surface, relative to clear skies with same T& T & RH, by time-mean 41 W m-2* (little impact at TOA) • Can warm 1m of ice by 1.8 K/day, or melt 1 cm of 0C ice per day, • barring any other mechanisms !
Great websites with real-time data, historical fotos: http://www.arctic.noaa.gov/ http://nsidc.org http://nsidc.org/cryosphere/glance http://nsidc.org/data/seaice-index/
Thank you ! Paquita Zuidema, RSMAS/MPO, MSC118, March 2 2007