Detecting Arctic Change Using the Koppen Climate Classification
140 likes | 341 Vues
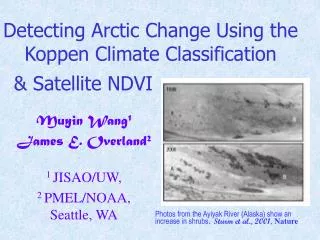
Detecting Arctic Change Using the Koppen Climate Classification. & Satellite NDVI. Muyin Wang 1 James E. Overland 2 1 JISAO/UW, 2 PMEL/NOAA, Seattle, WA. Photos from the Ayiyak River (Alaska) show an increase in shrubs . Sturm et al., 2001 , Nature. The Koppen Classification. Data.

Detecting Arctic Change Using the Koppen Climate Classification
E N D
Presentation Transcript
Detecting Arctic Change Using the Koppen Climate Classification & Satellite NDVI Muyin Wang1 James E. Overland2 1 JISAO/UW, 2 PMEL/NOAA, Seattle, WA Photos from the Ayiyak River (Alaska) show an increase in shrubs.Sturm et al., 2001, Nature
The Koppen Classification Data NCEP/NCAR reanalysis 2.5x2.5 1948-2002 Kalnay, et al, 1996 CRU/UA TS2.0 0.5x0.5 1901-2000 Mitchell, et al, 2003
Vegetation Distribution based on Koppen Classification Tundra NCEP Frost Boreal 1978 1998 Temperate CRU 1950 1998
Calculated Vegetation Distribution Based on CRU/ NCEP 106 km2 Tundra 106 km2 Boreal Temperate 106 km2
NIR – VIS NIR + VIS NDVI = Satellite Normalized Differences Vegetation Index (NDVI) is calculated from the visible (VIS) and near-infrared (NIR) light reflected by vegetation in the AVHRR channels. The value increases from 0.1 to 0.9 for progressively increasing amounts of green vegetation. Global monthly NDVI data set is provided by NASA on 1x1o resolution from July 1981 to September 2001.
1.0 0.8 0.6 0.4 0.2 0.0 Distribution of vegetation type based on Koppen classification The summer NDVI climatology The lost tundra areas The change in NDVI from 1980s to 90s
CONCLUSIONS • The potential impact of vegetation changes to feedbacks on the climate system is enormous because of their large land area and multiyear memory of the vegetation cover in the Arctic region. • The Koppen classification based on SAT agrees well with satellite NDVI. Both indicate a significant decrease in the tundra area in the past 20 years – about 1 million km2 lost. • A similar decreasing trend was seen in the early 1900s, but with smooth slope.
The Area of Tundra Group Based on CRU SAT And the Averaged NASA NDVI for 50-90oN Correlation = -0.70
Tundra Boreal + Temperate Anomalies of Vegetation Group for Sub-regions Scandinavia Siberia N.W. America N.E. America
THE LOST TUNDRA AREA: Max - Min CRU: 1950 – 1998 NCEP: 1978 -1998
Tundra Boreal Anomalies of Tundra & Boreal for sub-regions in Arctic 10oW ~120oE 106 km2 Scandinavia Siberia 120oE ~170oW 106 km2 170oW ~80oW 106 km2 N.W. America N.E. America 80oW ~40oW 106 km2