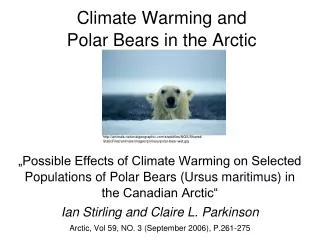
Climate Warming and Polar Bears in the Arctic
„Possible Effects of Climate Warming on Selected Populations of Polar Bears (Ursus maritimus) in the Canadian Arctic“ Ian Stirling and Claire L. Parkinson Arctic, Vol 59, NO. 3 (September 2006), P.261-275 Climate Warming and Polar Bears in the Arctic

Climate Warming and Polar Bears in the Arctic
E N D
Presentation Transcript
„Possible Effects of Climate Warming on Selected Populations of Polar Bears (Ursus maritimus) in the Canadian Arctic“ Ian Stirling and Claire L. Parkinson Arctic, Vol 59, NO. 3 (September 2006), P.261-275 Climate Warming and Polar Bears in the Arctic http://animals.nationalgeographic.com/staticfiles/NGS/Shared/StaticFiles/animals/images/primary/polar-bear-wet.jpg
„In this paper, we evaluate patterns of sea-ice breakup (...) to test the hypothesis that sightings of more polar bears in these populations are due in part to changes in sea ice, possibly resulting from climate warming, and do not necessarily indicate population increases.“ Hypothesis
Picture from the discussed paper, p. 263 Study Area: Eastern Canadian Arctic http://www.map-of-canada.org/canada-map.gif
The five areas are ice-free in summer They are chosen according to polar bear subpopulations Study Area: Eastern Canadic Arctic
-Satellite data from 1972 to 2004 -Measurement of microwave radiance: →Easily pass through most clouds →Ice and water differ -Used in this study:→ Date on wich the total cover of sea ice declined to 50% →Ecologically significant (other study) Methods: Measurement of Sea Ice
Western Hudson Bay – Results p=0.003
Western Hudson Bay – Discussion • polar bearsareforcedtocomeashoreearlierandto fast earlierandlonger • relationshipbetweendateofbreakupandconditionofthebears (Stirling et al. 1999) • polar bearpopulationdeclinedby 22 % between 1987 and 2004 (Regehr et al. 2005) → morelikelythatmore polar bearsareseennearcostalsettlementsbecausetheyarehungryratherthantheirpopulationhasincreased
Davis Strait – Results p=0.35
Davis Strait – Discussion • unknownsizeof polar bearpopulation • increasedabundanceofpreybetween 1970s and 1990s, stabilized in theearly 1990s → probably polar bearpopulationincreasedbetween 1970s and 1990s, but itislikelythatpopulationis not longerincreasing
Evaluation: Strengths • Long observation period (over 30 years) • Reliable data source (satellites) • Large study area • Investigation of areas that are ecologically meaningful for the polar bear
Evaluation: Weakness 1 • No division of results and discussion • This leads to Piramyding: They interlace own results, results from other studies and the discussion of both • Mixture of meta study and original study
Evaluation: Weakness 2 • EHB: Their own data is not significant→They do not discuss why, mention other studies that support their thesisand conclude from the other studies (P. 271) • Much additional information that does not directely deal with the main thesis • Citation of unpublished results or observations from himself (9 times)
Own Opinion in short • Good data and interpretation • The main points could have been summarized within 4 pages