
Uploaded by
paul2
15 SLIDES
327 VUES
150LIKES
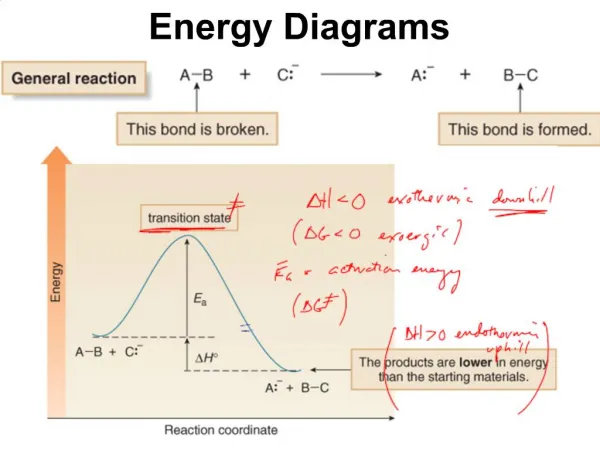
Energy Diagrams
DESCRIPTION
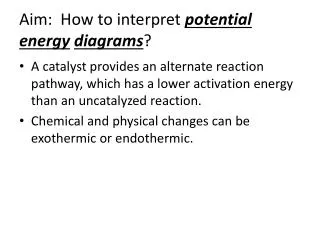
Energy diagrams show the energy changes in chemical reactions. Activation energy (Ea) is crucial as it determines reaction rates. Transition states provide a snapshot of the in-between stages. Utilize BDE TABLE for reference.
Download
1 / 15
Télécharger la présentation 
Energy Diagrams
An Image/Link below is provided (as is) to download presentation
Download Policy: Content on the Website is provided to you AS IS for your information and personal use and may not be sold / licensed / shared on other websites without getting consent from its author.
Content is provided to you AS IS for your information and personal use only.
Download presentation by click this link.
While downloading, if for some reason you are not able to download a presentation, the publisher may have deleted the file from their server.
During download, if you can't get a presentation, the file might be deleted by the publisher.
E N D
Presentation Transcript


More Related
Audio
Live Player