Infrasonic Observations of Earthquakes J. Paul Mutschlecner and R. W. Whitaker Los Alamos National Laboratory 2003 Infr
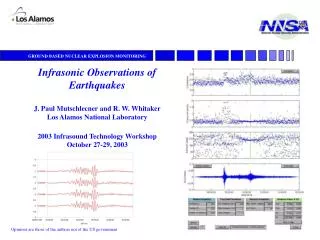
Infrasonic Observations of Earthquakes J. Paul Mutschlecner and R. W. Whitaker Los Alamos National Laboratory 2003 Infrasound Technology Workshop October 27-29, 2003 JaJolla, California. Opinions are those of the authors not of the US government. Overview.

Infrasonic Observations of Earthquakes J. Paul Mutschlecner and R. W. Whitaker Los Alamos National Laboratory 2003 Infr
E N D
Presentation Transcript
Infrasonic Observations of Earthquakes J. Paul Mutschlecner and R. W. Whitaker Los Alamos National Laboratory 2003 Infrasound Technology Workshop October 27-29, 2003 JaJolla, California Opinions are those of the authors not of the US government
Overview • Review infrasound signals from earthquakes • Understand infrasound signals with respect to earthquake characteristics • Provide estimate for earthquake infrasound signals • Discuss future directions - modeling and earthquake parameterization
Infrasound Earthquake Data Set • Number of earthquake events 30 • Number of signals 47 • Number of stations recording 4 • 1983 - 2002 • 13 multi-station detections • Analysis is ongoing
0.5-3.0 Hz data 2/22/02 M 5.7 32.38 N 115.35W Channel data and Infra_Tool Az Dev 1.7o
< Dq > = 2.94 deg s = 2.33 < Dq> = 1.47 deg s =3.47 Data Set Characteristics
Data Set Characteristics <Dur> = 14.0 min s = 9.4 <f> = 0.84 Hz s = 0.49
Duration (in min) vs Mb Examination of several other parameters Shows no well defined trends Possible indication of range dependence
Long Signal Duration for EQ • Source (EQ) duration • But most Earthquakes have motion over only a few seconds to a minute (aftershocks may contribute for larger Mb • Atmospheric propagation • Usual competition between pulse stretching and dissipation • HE signals of similar size have shorter durations • Source extension by seismic surface waves • Relation to magnitude supports this concept • Known cases of extended sources (eg Coalinga, 1983, and Northridge, 1994) • But for longest durations source must be ~100s km in diameter; and durations are not always symmetric about epicenter signal
Amplitude Scaling for Distance and Stratospheric Wind Where Vd - wind component directed, source to array Vz - zonal component of stratospheric (50 km) wind Vm - meridional component of stratospheric wind q- azimuth to source Distance and wind parameters are empirically derived and b = 1.45 and k = 0.018 See: “An Empirical Study of Infrasound Propagation”, 1999, J. Paul Mutschlecner, Rodney W. Whitaker and Lawrence H. Auer, LA-13620-MS, Los Alamos National Lboratory
Scaled Amplitude vs Mb(all events) • R2 = 0.591 • = 0.419 b = 0.454
Peak Vertical Velocity (at 1 km) and ML40 Events • R2 = 0.595 • = 0.230 b = 0.558 From: “Empirical Analysis of Near-Source Ground Motion,” 1980, A. F. Shakal and D. L. Bernreuter, NUREG/CR-2095 (UCRL-53028)
Statistical Simulations { } denote random variations
Results of Statistical Simulations 50 simulations Monte Carlo approach
Summary • Relations determined • Log(Asc) vs Mb • Duration vs Mb • Frequency vs depth • Uncertainty sources identified and ~ match to observations • Better earthquake source parameterization needed • Source modeling being established
Close-in Ground Motion Velocities for 10/15/79 EQ, Imperial Valley (6.6) From: “Empirical Analysis of Near-Source Ground Motion,” 1980, A. F. Shakal and D. L. Bernreuter, NUREG/CR-2095 (UCRL-53028)
Scaled Amplitude for Best Wind Data • R2 = 0.691 • = 0.405 b = 0.556