Download
1 / 35
350 likes | 373 Vues
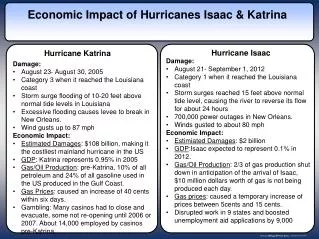
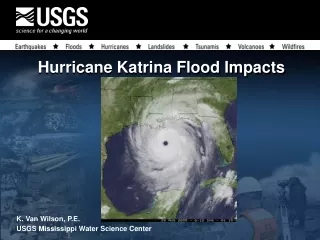
Hurricane Katrina Flood Impacts. K. Van Wilson, P.E. USGS Mississippi Water Science Center. The Inevitable Comparison. Hurricane Camille Category 5 August 17, 1969 Hurricane Katrina Category 4 August 29, 2005.

E N D
Hurricane Katrina Flood Impacts K. Van Wilson, P.E. USGS Mississippi Water Science Center
The Inevitable Comparison Hurricane Camille Category 5 August 17, 1969 Hurricane Katrina Category 4 August 29, 2005
The Inevitable Comparison Hurricane Camille • Most intense hurricane in US history • Maximum winds - 190+ mph • Central pressure – 909 mb (2nd lowest on record) • Maximum storm surge – 25 ft (nr Pass Christian, MS) • Width of storm - 110 miles • Death toll - 256 • Damage - $1.4 Billion
The Inevitable Comparison Hurricane Katrina • Most destructive hurricane in US history • Maximum winds - 140 mph • Central pressure – 920 mb (3rd lowest on record) • Maximum storm surge – 29 ft (nr Bay St. Louis, MS) • Width of storm - 250 miles • Death toll – 1300 ? • Damage - $200 Billion ?
Recorded Storm-Surge Hydrographs at Selected River Gages • Stage • Specific Conductance (saltwater intrusion identifier)
Storm Surge Escatawpa River Gage
Escatawpa River about 10.5 miles upstream of mouth (Station no. 0248018020)
Storm Surge Pascagoula River Gage
Pascagoula River about 34.4 miles upstream of mouth (Station no. 02479310)
Comparison of selected Katrina HWMs along a coastal baseline
Storm Surge WindSpeed Modeling conducted by: Mississippi State University GeoResources Institute Stennis Space Center Model and Supercomputer provided by: WorldWinds Inc. Stennis Space Center
Storm Surge WindSpeed Modeling conducted by: Mississippi State University GeoResources Institute Stennis Space Center Model and Supercomputer provided by: WorldWinds Inc. Stennis Space Center
Storm Surge WindSpeed Modeling conducted by: Mississippi State University GeoResources Institute Stennis Space Center Model and Supercomputer provided by: WorldWinds Inc. Stennis Space Center
Storm Surge WindSpeed Modeling conducted by: Mississippi State University GeoResources Institute Stennis Space Center Model and Supercomputer provided by: WorldWinds Inc. Stennis Space Center
Storm Surge WindSpeed Modeling conducted by: Mississippi State University GeoResources Institute Stennis Space Center Model and Supercomputer provided by: WorldWinds Inc. Stennis Space Center
Storm Surge WindSpeed Modeling conducted by: Mississippi State University GeoResources Institute Stennis Space Center Model and Supercomputer provided by: WorldWinds Inc. Stennis Space Center
Storm Surge WindSpeed Modeling conducted by: Mississippi State University GeoResources Institute Stennis Space Center Model and Supercomputer provided by: WorldWinds Inc. Stennis Space Center
Storm Surge WindSpeed Modeling conducted by: Mississippi State University GeoResources Institute Stennis Space Center Model and Supercomputer provided by: WorldWinds Inc. Stennis Space Center
Storm Surge WindSpeed Modeling conducted by: Mississippi State University GeoResources Institute Stennis Space Center Model and Supercomputer provided by: WorldWinds Inc. Stennis Space Center
Cross-section profile 150 feet North of U.S. Highway 90 at St. Louis Bay. 5.0 Sept. 19, 2005 Aug. 24, 2000 0.0 8 8 9 -5.0 1 D V A N , t -10.0 e e f n i n o i t a -15.0 v e l E -20.0 120 127 133 I RIGHT LEFT IV (WEST) (EAST) JETTY JETTY -25.0 0 0 0 0 0 0 0 0 0 0 0 0 0 0 0 0 + + + + + + + + 2 6 8 0 8 0 2 4 3 2 3 2 1 2 2 2 3 3 3 3 3 3 3 3 Bridge Damage & Bed Scour
Comments or Questions? K. Van Wilson, P.E. USGS Mississippi Water Science Center