Investment, Saving, and the Real Interest Rate
10. Investment, Saving, and the Real Interest Rate. CHAPTER. C H A P T E R C H E C K L I S T. When you have completed your study of this chapter, you will be able to.


Investment, Saving, and the Real Interest Rate
E N D
Presentation Transcript
10 Investment, Saving, and the Real Interest Rate CHAPTER
C H A P T E R C H E C K L I S T When you have completed your study of this chapter, you will be able to • 1Define and explain the relationships among capital, investment, wealth, and saving; and describe the markets for financial capital. • 2 Explain how investment and saving decisions are made and how these decisions interact in the market for loanable funds to determine the real interest rate and the amount of investment and saving. 3 Explain how government influences the real interest rate, investment, and saving.
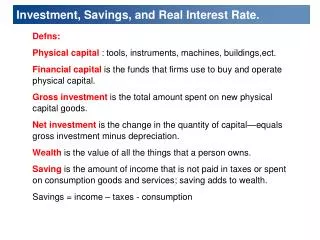
10.1 PHYSICAL CAPITAL AND FINANCIAL CAPITAL • Physical capitalis the tools, instruments, machines, buildings, and other constructions that have been produced in the past and that are used to produce goods and services. • Financial capitalis the funds that firms use to buy and operate physical capital.
10.1 PHYSICAL CAPITAL AND FINANCIAL CAPITAL • Investment and Capital • Gross investment is the total amount spent on new capital goods. • Net investment is the change in the quantity of capital—equals gross investment minus depreciation.
10.1 PHYSICAL CAPITAL AND FINANCIAL CAPITAL Figure 10.1 illustrates the relationship between capital and investment. On January 1, 2008,Tom’s DVD Burning, Inc. had DVD recording machines valued at $30,000.
10.1 PHYSICAL CAPITAL AND FINANCIAL … During 2008, the value of Tom machines falls by $20,000, depreciation. He spent $30,000 on new machines—gross investment. Tom’s net investment was $10,000, so at the end of 2008,Tom had capital valued at $40,000.
10.1 PHYSICAL CAPITAL AND FINANCIAL CAPITAL • Wealth and Saving • Wealthis the value of all the things that a person owns. • Savingis the amount of income that is not paid in taxes or spent on consumption goods and services; saving adds to wealth.
10.1 PHYSICAL CAPITAL AND FINANCIAL CAPITAL • Markets for Financial Capital • Saving is the source of funds that are used to finance investment, and these funds are supplied and demanded by four groups of markets: • Stock markets • Bond markets • Short-term securities markets • Loans markets
10.1 PHYSICAL CAPITAL AND FINANCIAL CAPITAL • Stock Markets • Stock is a certificate of ownership and claim to the profits that a firm makes. • Stock market is a financial market in which shares of companies’ stocks are traded.
10.1 PHYSICAL CAPITAL AND FINANCIAL CAPITAL • Bond Markets • Bond is a promise to pay specified sums of money on specified dates; it is a debt for the issuer. • Bond market is a financial market in which bonds issued by firms and governments are traded.
10.1 PHYSICAL CAPITAL AND FINANCIAL CAPITAL • Short-Term Securities Markets • Short-term securities are commercial bills and Treasury bills—promises by large firms and government to pay an agreed sum 90 days in the future. • Loans Markets • Banks and other financial institutions lower the cost of financing firms’ capital expenditures by accepting short-term deposits and making longer-term loans.
10.1 PHYSICAL CAPITAL AND FINANCIAL CAPITAL • Global Financial Markets • Lending is risky. A loan might not be repaid. Or the price of a stock or bond might fall. The riskier the loan, other things being equal, the higher is the interest rate. • For a given risk, lenders want to earn the highest possible real interest rate and they will look everywhere in the world to find the highest real interest rate. • Borrowers want to pay the lowest possible real interest rate. So borrowers will look everywhere in the world to find the lowest real interest rate.
10.1 PHYSICAL CAPITAL AND FINANCIAL CAPITAL Because lenders are free to seek the highest real interest rate and borrowers are free to seek the lowest real interest rate, financial markets form a single, integrated, global market. • The aggregate of all the individual financial markets is called the market for loanable funds.
10.1 PHYSICAL CAPITAL AND FINANCIAL CAPITAL • Interest Rates and Asset Prices • Stocks, bonds, short-term securities, and loans are collectively called financial assets. • The interest rate on a financial asset is a percentage of the price of the asset. • So if the asset price rises, other things remaining the same, the interest rate falls. • And conversely, if the asset price falls, other things remaining the same, the interest rate rises.
10.2 THE MARKET FOR LOANABLE FUNDS • Flows in the Market for Loanable Funds • Loanable funds are used for • 1. Business investment • 2. Government budget deficit • 3. International investment or lending • Loanable funds come from • 1. Private saving • 2. Government budget surplus • 3. International borrowing
10.2 THE MARKET FOR LOANABLE FUNDS • The Demand for Loanable Funds • The quantity of loanable funds demanded depends on • 1. The real interest rate • 2. The expected profit • The real interest rate is the opportunity cost of the funds used to finance the purchase of capital. • So firms compare the real interest rate with the rate of profit that they expect to earn on their new capital.
10.2 THE MARKET FOR LOANABLE FUNDS • Firms invest only when they expect to earn a rate of profit that exceeds the real interest rate. • The higher the real interest rate, the fewer projects that are profitable, so the smaller is the quantity of loanable funds demanded. • The lower the real interest rate, the more projects that are profitable, so the larger is the quantity of loanable funds demanded.
10.2 THE MARKET FOR LOANABLE FUNDS • Demand for Loanable Funds Curve • The demand for loanable funds curve is the relationship between the quantity of investment demanded and the real interest rate, other things remaining the same. • The demand for loanable funds is shown by an demand for loanable funds schedule or curve.
10.2 THE MARKET FOR LOANABLE FUNDS Figure 10.2 shows the demand for loanable funds. The table and figure show the quantity of loanable funds demanded at five real interest rates. Points A through E on the curve DLF correspond to the rows in the table.
10.2 THE MARKET FOR LOANABLE FUNDS 1. A rise in the real interest rate decreases the quantity of loanable funds demanded. 2. A fall in the real interest rate increases the quantity of loanable funds demanded.
10.2 THE MARKET FOR LOANABLE FUNDS • Changes in the Demand for Loanable Funds • When the expected profit changes, the demand for loanable funds changes. • Other things remaining the same, the greater the expected profit from new capital, the greater is the amount of investment and the greater is the demand of loanable funds .
10.2 THE MARKET FOR LOANABLE FUNDS • The many influences on expected profit can be placed in three groups: • Objective influences such as the phase of the business cycle, technological change, and population growth • Subjective influences summarized in the phrase “animal spirits” • Contagion effects summarized in the phrase “irrational exuberance”
10.2 THE MARKET FOR LOANABLE FUNDS Figure 10.3 shows : 1. An increase in expected profit increases investment and shifts the demand for loanable funds curve rightward to DLF1. 2. A decrease in expected profit decreases investment and shifts the demand for loanable funds curve leftward to DLF2.
10.2 THE MARKET FOR LOANABLE FUNDS • Supply of Loanable Funds • The quantity of loanable funds supplied is the total funds available from private saving, the government budget surplus, and international borrowing during a given period. • Saving is the main item and it depends on • 1. The real interest rate • 2. Disposable income • 3. Wealth • 4. Expected future income
10.2 THE MARKET FOR LOANABLE FUNDS • Other things remaining the same, • The higher the real interest rate, the greater is the quantity of saving and the greater is the quantity of loanable funds supplied. • The lower the real interest rate, the smaller is the quantity of saving and the smaller is the quantity of loanable funds supplied.
10.2 THE MARKET FOR LOANABLE FUNDS • The Supply of Loanable Funds Curve • The supply of loanable funds is the relationship between the quantity of loanable funds supplied and the real interest rate when all other influences on lending plans remain the same. • The real interest rate is the opportunity cost of consumption expenditure. • A dollar spent is a dollar not saved, so the interest that could have been earned on that saving is forgone.
10.2 THE MARKET FOR LOANABLE FUNDS Figure 10.4 shows supply of loanable funds. The table and figure show the quantity of loanable funds supplied at five real interest rates. Points A through E on the curve correspond to the rows in the table.
10.2 THE MARKET FOR LOANABLE FUNDS 1. A rise in the real interest rate increases the quantity of loanable funds supplied. 2. A fall in the real interest rate decreases the quantity of loanable funds supplied.
10.2 THE MARKET FOR LOANABLE FUNDS • Changes in Supply of Loanable Funds • The three main factors that influence saving and change the supply of loanable funds are 1. Disposable income 2. Wealth 3. Expected future income
10.2 THE MARKET FOR LOANABLE FUNDS • Disposable income is the income earned minus net taxes. • Other things remaining the same, • The greater a household’s disposable income, the greater is its saving. • The greater a household’s wealth (what it owns), the less it will save. • The higher a household’s expected future income, the smaller is its saving today.
10.2 THE MARKET FOR LOANABLE FUNDS • Shifts of the Supply of Loanable Funds Curve • Along the supply of loanable funds curve, all the influences on saving other than the real interest rate remain the same. • A change in any of these influences on saving changes saving and shifts the supply of loanable funds curve.
10.2 THE MARKET FOR LOANABLE FUNDS Figure 10.5 shows a change in the supply of loanable funds. 1. The supply of loanable funds curve shifts rightward from SLF0 to SLF1 if • Disposable income increases • Wealth decreases • Expected future income decreases
10.2 THE MARKET FOR LOANABLE FUNDS 2. The supply of loanable funds curve shifts leftward from SLF0 to SLF2 if • Disposable income decreases • Wealth increases • Expected future income increases
10.2 THE MARKET FOR LOANABLE FUNDS • Equilibrium in the Market for Loanable Funds • Figure 10.6 shows how the real interest rate is determined. • DLF is the demand for loanable funds curve • SLF is the supply of loanable funds curve
10.2 THE MARKET FOR LOANABLE FUNDS 1. If the real interest rate is 8 percent a year, the quantity demanded is less than the quantity supplied. There is a surplus of funds. The real interest rate falls. 2. If the real interest rate is 4 percent a year, the quantity demanded exceeds the quantity supplied. There is a shortage of funds. The real interest rate rises.
10.2 THE MARKET FOR LOANABLE FUNDS 3. When the real interest rate is 6 percent a year, the quantity of loanable funds demanded equals the quantity supplied. There is neither a shortage nor a surplus of funds, and the real interest rate is at its equilibrium level.
10.2 THE MARKET FOR LOANABLE FUNDS • Changes in Demand and Supply • 1. If the demand for loanable funds increases, the real interest rate rises. • 2. If the supply of loanable funds increases, the real interest rate falls.
10.3 GOVERNMENT IN LOANABLE FUNDS MARKET • Government Budget and Government Saving • GDP is the sum of consumption expenditure C, investment I, government expenditure G, and net exports NX. • In the global economy, net exports are zero, so for the world as a whole: • Y = C + I + G. • GDP equals total income, which is the sum of consumption expenditure C, saving S, and net taxes NT. That is, • Y = C + S + NT.
10.3 GOVERNMENT IN LOANABLE FUNDS MARKET • Y = C + I + G • Y = C + S + NT • By combining these two equations: C + I + G = C + S + NT • Subtract C and simplify the equation to • I + G = S + NT • Now subtract G from both sides of this equation to obtain • I = S + (NT – G)
10.3 GOVERNMENT IN LOANABLE FUNDS MARKET • I = S + (NT – G) • This equation tells us that investment is financed by private saving S and government saving (NT – G). • Government saving (NT – G) is also the government budget surplus.
10.3 GOVERNMENT IN LOANABLE FUNDS MARKET • Total saving equals private saving plus government saving. • So when the government has a budget surplus, it contributes toward financing investment. • But when the government has a budget deficit, it competes with businesses for private saving and decreases the amount available for investment.
10.3 GOVERNMENT IN LOANABLE FUNDS MARKET • Effect of Government Saving • A government budget surplus increases the supply of loanable funds. • To find the supply of loanable funds, we must add the government budget surplus to private saving supply. • An increase in the supply of loanable funds brings a lower real interest rate, which decreases the quantity of private funds supplied and increases the quantity of investment and the quantity of loanable funds demanded.
10.3 GOVERNMENT IN LOANABLE FUNDS MARKET Figure 10.8 shows the effects of government saving. With balanced government budgets, the real interest rate is 6 percent a year and the quantity of loanable funds is $10 trillion a year. 1. A government budget surplus of $2 trillion is added to private saving to determine the supply of loanable funds curve SLF.
10.3 GOVERNMENT IN LOANABLE FUNDS MARKET 2. The real interest rate falls to 4 percent a year. 3. The private supply of funds decreases to $9 trillion. 4. The quantity of loanable funds demanded and investment increase to $11 trillion.
10.3 GOVERNMENT IN LOANABLE FUNDS MARKET • Government Deficit and Crowding Out • A government budget deficit works in the opposite way to the surplus. • The total supply of loanable funds equals private saving minus the government budget deficit. • But a decrease in the supply of loanable funds raises the real interest rate, which increases the quantity of private funds supplied. • What happens to investment?
10.3 GOVERNMENT IN LOANABLE FUNDS MARKET • The tendency for a government budget deficit to raise the real interest rate and decrease investment is called the crowding-out effect.
10.3 GOVERNMENT IN LOANABLE FUNDS MARKET Figure 10.8 shows a crowding-out effect. With balanced government budgets, the real interest rate is 6 percent a year and the quantity of loanable funds is $10 trillion a year. Private saving and investment are 10 trillion a year.
10.3 GOVERNMENT IN LOANABLE FUNDS MARKET 1.A government budget deficit is subtracted from private saving to determine the total supply of loanable funds curve SLF.
10.3 GOVERNMENT IN LOANABLE FUNDS MARKET 2.The real interest rate rises to 8 percent a year. 3. Private saving increases to $11 trillion. 4.Total saving and investment decrease to $9 trillion. Investment is crowded out.