Download
1 / 24
240 likes | 328 Vues
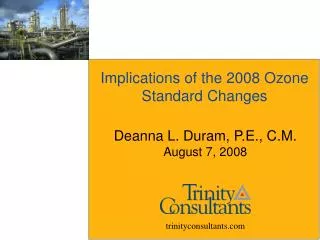
Explore radiative forcing due to O3 changes, temperature responses, and model simulations with Harvard-GISS data. Uncertainties in natural emissions affect O3 radiative forcing. Discover climate sensitivity to CO2 and O3 and their influence on global temperature changes. Evaluate the comparison of forcings between CO2 and O3.

E N D
Climatic implications of changes in O3 How well do we know radiative forcing due to tropospheric O3 change? What is the temperature response to changing O3? How useful is radiative forcing as a measure of temperature response? Loretta J. Mickley, Daniel J. Jacob Harvard University David Rind Goddard Institute for Space Studies
How well do we know the forcing due to changing O3? IPCC 2001
Photochemical models tend to overpredict preindustrial O3 Marenco et al., 1994 Preindustrial ozone models }
Attempt to model preindustrial O3, Harvard model model observations Uncertainties: Lightning NO emissions + soil NO emissions (O3 source) emissions of biogenic hydrocarbons (O3 sink in low-NOx atmosphere)
Harvard-GISS General Circulation Model • GISS GCM II’ meteorology • 9 sigma layers, 4o by 5o horizontal grid • 24 chemical tracers • Detailed O3-NOx-hydrocarbon chemistry • 80 chemical species, > 400 chemical reactions • Preindustrial atmosphere: • No fossil fuel combustion, 10% present-day biomass burning • Approach to predindustrial O3 problem: construct a test simulation, adjusting the natural emissions within (or not far from) uncertainties.
Uncertainties in natural emissions Biogenic emissions Isoprene 200-600 Tg C y-1825 Tg y-1 Monoterpenes 130? Tg C y-1200 Tg y-1 Lightning NO 1-20 Tg N y-1 1.0 Tg y-1 Soil NO 4-13 Tg N y-12.0 Tg y-1 Adjusted simulation
Uncertainty of radiative forcing due to O3 is quite large. Test simulation with Decreased lightning NOx and soil NOx emissions and Increased biogenic emissions: DF = 0.80 Wm-2 (about 1/2 DF of CO2) Standard simulation, DF = 0.44 Wm-2
How has the change in O3 affected climate? 3 pairs of simulations with climate model O3 fields allowed to influence meteorology 75 years each, “qflux ocean” (SST allowed to change) 1.Calculated O3 : Present-day O3vs Preindustrial O3 2.Does the inhomogeneity of O3 change matter? Preindustrial with18 ppb increase O3 everywhere vs Preindustrial O3 (18 ppb = globally averaged increase since preindustrial times) 3.Is the climate more sensitive to O3 change than to CO2?: Control run vs Control run with 25 ppm decrease in CO2 (25 ppm yields same globally averaged forcing as change in O3.)
Response of surface temperature to tropospheric O3 change Temperature diverges for the two simulations DT = ~0.3o C
Response of temperature throughout atmosphere to changing O3 50-year averages Stronger temperature response in NH Temperature increases throughout troposphere, but decreases in stratosphere due to decreased upward flux in 9.6m band.
Temperature response to uniform O3 change Changing O3 everywhere by 18 ppb leads to smaller interhemispheric temperature differences.
Response of temperature to changing CO2 Temperature increase at surface due to CO2 is almost 0.4o C, compared to 0.3o C for O3. In lower stratosphere, CO2 change leads to an increase in temperature, while O3 change leads to a decrease.
How do forcings of CO2 and uniform O3 compare? Difference plot, CO2 – uniform O3 CO2 shows weaker forcing over tropics, but stronger forcing over poles, where climate is more responsive due to positive albedo feedback.
Water vapor limits CO2 radiative forcing over tropics Longwave forcing from change in CO2 correlates with specific humidity at 500 mb over tropics. R2 O3 = 0.07 R2 CO2 = 0.69 Water vapor absorbs strongly at CO2 wavelengths, swamping the effect of CO2. Same globally avgd forcing leads to stronger forcing at poles for CO2.
Clouds also limit longwave CO2 forcing CO2 LW forcing correlates even better with high cloud cover over tropics. R2 O3 = 0.13 R2 CO2 = 0.86
How do forcings of CO2 and calculated O3 compare? SW forcing CO2 forcing is more uniform and stronger in SH. O3 forcing at high Northern latitudes is mostly shortwave forcing due to Arctic snow and ice, together with high O3 concentrations.
Increased O3 leads to large albedo decrease over Arctic Surface temperature increases over Arctic for both CO2 and calculated O3 change. Large albedo decrease over Arctic = negative feedback on O3 forcing Snow+ice melt, albedo decreases, smaller shortwave forcing, smaller than expected temperature change
Conclusions Uncertainty in forcing due to tropospheric ozone added to the atmosphere since preindustrial times is larger than usually thought. DF may be as much as 0.8 Wm-2 . Globally averaged radiative forcing of changing tropospheric O3 may have limited value as indicator of climate change. Reasons for apparent smaller sensitivity in O3 case: • Water vapor and clouds limit CO2 forcing over tropics, so for the same globally averaged DF, CO2 forcing is larger over poles. • Shortwave forcing due to O3 change at high latitudes is reduced due to a negative albedo feedback.
Relationship of isoprene and OH In low-NOx preindustrial atmosphere, OH is depleted at surface, and isoprene builds. Isoprene then becomes a sink of ozone.
Contribution of lightning NOx to surface O3 Second test simulation: Decrease in lightning NOx only Lightning from tropics influences surface ozone at mid-latitudes in winter. Only lightning NOx decreased
Surface distribution of present-day O3 in July (ppb) Greater concentrations over industrial areas and regions of biomass burning.
What is the effect of shortwave forcing due to O3? LW + SW – 0.49 Wm-2 LW only – 0.37 Wm-2 SW forcings for calculated O3 strongest over Arctic due to ice, snow, and high O3 concentrations.
Response of temperature to 2xCO2 Stronger temperature response in NH due to stronger positive albedo effect. Warmer temperature, less ice+snow cover, more incoming sunlight absorbed, still warmer tempertures