Download
1 / 48
480 likes | 634 Vues
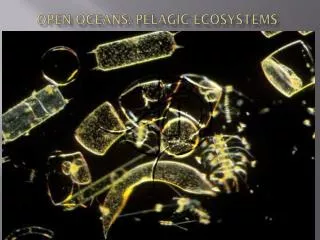
Impact of large-scale climatic changes on pelagic ecosystems in the North Atlantic. Grégory Beaugrand. CNRS, UMR 8013 ELICO Station Marine Wimereux Université des sciences et technologies de Lille 1 BP 80, 62930 Wimereux France Email: Gregory.Beaugrand@univ-lille1.fr.

E N D
Impact of large-scale climatic changes on pelagic ecosystems in the North Atlantic Grégory Beaugrand CNRS, UMR 8013 ELICO Station Marine Wimereux Université des sciences et technologies de Lille 1 BP 80, 62930 Wimereux France Email:Gregory.Beaugrand@univ-lille1.fr Reykjavik, 12-14th March 2005
Objectives of this talk • To document responses of plankton to hydro-climatic forcing • To show the potential consequences of climate-induced plankton changes for the structure and the functioning of the pelagic ecosystems, for higher trophic levels (Fish) and biogeochemical cycles
Continuous Plankton Recorder (CPR) Survey First tow September 1931 Herring Packers & Drifters Sir Alister Hardy
Information in the CPR database>400 species or taxa Dinoflagellates Diatoms Copepods 108 taxa Other zooplankton Meroplankton Euphausiids
Climatic variability in the North Atlantic Ocean NAO NAO (January to March) 1988 EA EA (September to April) 1982 EA-jet EA - Jet (April to August) 1987
Long-term changes in sea surface temperature (1960-1997) From Beaugrand et al. (2002). Science. 296: 1692-1694.
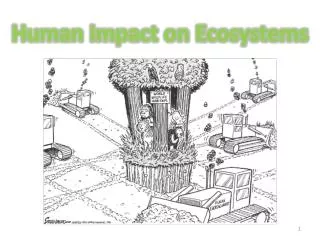
What kind of biological consequences are expected under climatic warming? • Changes in the range and spatial distribution of species • Shifts in the location of biogeographical boundaries, provinces and biomes • Change in the phenology of species (e.g. earlier reproductive season) • Modification in dominance (e.g. a key species can be replaced by another one) • Change in diversity • Change in other key functional attributes for marine ecosystems • Change in structure and dynamics of ecosystem with possible regime shifts Major impact for marine exploited resources and biogeo- chemical processes (e.g. sequestration of CO2 by the ocean)
Plankton response to hydro-climatic forcing 1. Biogeographical shifts
Warm-temperate shelf- edge species Temperate shelf- edge species Mean number of species per association Beaugrand et al. (2002) Science. Vol. 296. 1692-1694.
Cold-temperate (mixed water) species Subarctic species Mean number of species per association Beaugrand et al. (2002) Science. Vol. 296. 1692-1694.
Plankton response to hydro-climatic forcing 2. Changes in biodiversity
Long-term monthly changes in calanoid copepod diversity The North Sea (north and central part) Line in black: warm-temperate species Line in red: temperate species 12 5 11 4.5 M O N T H S 10 4 9 8 3.5 7 3 6 2.5 5 2 4 1.5 3 2 1 1 58 62 66 70 74 78 82 86 90 94 98 Years Mean number of calanoid species per CPR sample Before 1980 After 1980
Relationships between taxonomic diversity and size diversity for calanoid copepods 6 5 4 Size diversity 3 2 r² = 0.93 n = 540 pACF <0.01 1 0 0 1 2 3 4 Taxonomic diversity Beaugrand et al. (in prep)
Plankton response to hydro-climatic forcing 3. Relationships between changes in plankton and fish
Gadoid species (cod) Flatfish plankton change plankton change salinity SST NHT anomalies Westerly wind Beaugrand (2004) PROOCE
Regime shifts in the North Sea and in the Pacific Ocean Beaugrand & Ibanez (in press, MEPS) Beaugrand G (2004) Progress in Oceanography
Regime shifts in the North Sea and in the Pacific Ocean Beaugrand & Ibanez (in press, MEPS) Beaugrand G (2004) Progress in Oceanography
Plankton response to hydro-climatic forcing 4. Relationships between changes in plankton and the Atlantic salmon
1987 NHT anomalies Phytoplankton C. finmarchicus Salmo salar Beaugrand and Reid (2003) Global Change Biology
Local hydro-climatic changes in the north-east Atlantic and the North Sea: SMW / MRPP analyses
Cluster Analysis: grouping years as a function of physical and biological characters Variables : Sea SurfaceTemperature NE Atlantic Northern Hemisphere Temperature North Atlantic Oscillation Phytoplankton Zooplankton (3 taxa) Salmon catches Beaugrand & Reid, 2003 Global Change Biology 9, 801-807
Plankton response to hydro-climatic forcing 5. Relationships between changes in plankton and cod
Plankton indicator of larval cod survival fish larvae Euphausiids Calanus (from egg to adults) Pseudocalanus March July October • Total biomass of calanoid copepods • Mean size of calanoid copepod (ratio prey length/larval length=0.05)
Long-term change in the plankton index and cod recruitment (at age 1, one-year lag) Beaugrand et al. (2003) Nature. Vol. 426. 661-664.
Plankton and cod recruitment Beaugrand et al. (2003) Nature. Vol. 426. 661-664.
Plankton and cod recruitment Beaugrand et al. (2003) Nature. Vol. 426. 661-664.
Consequences of plankton changes on higher trophic level (3) Mean size of calanoid copepod prey Ratio length of prey / length of larvae 1. Mismatch between size of prey and larval cod Beaugrand, et al. (2003) Nature. Vol. 426. 661-664.
Long-term changes in the abundance of two key species in the North Sea Percentage of C. helgolandicus Reid et al. (2003)
Consequences of plankton changes on higher trophic level (3) Abundance of C. finmarchicus Abundance of C. helgolandicus 2. Mismatch between the timing of calanus prey and larval cod Beaugrand, et al. (2003) Nature. Vol. 426. 661-664.
Consequences of plankton changes on higher trophic level (3) Mean biomass of calanoid copepod preys Abundance of euphausiids 3. Quantitative changes unfavourable for larval/juvenile survival Beaugrand, et al. (2003) Nature. Vol. 426. 661-664.
warming of temperature (-) (+) Larval metabolism Decrease in the number of prey (-) (+) (-) (+) Energetic demand Energetic gain Energetic imbalance (-) Growth and survival (-) Overfishing Reduction in recruitment
Plankton response to hydro-climatic forcing 6. Changes in the functioning of pelagic ecosystems with possible consequences for biogeochemical cycles Exemple of the North Sea
Functional warming of North Sea marine ecosystems: decrease in the mean size of calanoid copepods Principal component 2 (in black) Eigenvector 2 (17.52%) Beaugrand et al. (in prep)
Long-term monthly changes in the minimum turnover of biogenic carbon 12 11 7.5 10 7 9 8 6.5 7 Months Minimum turnover (in day) 6 6 5 5.5 4 5 3 2 4.5 1 60 65 70 75 80 85 90 95 Increase in the ecosystem metabolism Years (1958-1999)
Long-term monthly changes in the mean residence time of carbon above 50 m 12 3.2 11 3 10 9 2.8 8 2.6 Residence time (in day) 7 Months 2.4 6 5 2.2 4 2 3 1.8 2 1 60 65 70 75 80 85 90 95 Potential decrease in carbon sink in the North Sea Years (1958-1999)
Response of the pelagic ecosystem to climate change Warm period: 1987-2002 Cold period: 1964-1981 • Increase in carbon recycling (ecosystem metabolism) • Decrease in exportation
Adaptation of North Sea ecosystems to a new regime Minimum size (1958-2002) Diversity (1958-2002) Biomass (1958-2002) Difference between the period 1964-1980 and 1987-2002
Shift in the location of the main biogeographical boundaries 1965-1981 1987-2002 First principal component First principal component Analysis with mean size, diversity, total biomass and temperature
Response of the pelagic ecosystem to climate change Diatom diversity Dinoflagellate diversity Mean number of species per CPR sample
Conclusions • Examination of data from the CPR survey have revealed major changes in the plankton ecosystems in European seas • Plankton ecosystem changes are related to large-scale climatic variability (e.g. NAO and NHT) • Strong potential consequences for exploited resources
Aknowledgments • Philip C Reid (SAHFOS) • Keith Brander (ICES, Copenhagen) • Frederic Ibanez (LOV, Villefranche-sur-mer)
Mean size of calanoid copepods (minimum size of female) G. Beaugrand
Biotic anomalies around the United Kingdom Biological materials: Euphausiids, Calanus, phytoplankton colour Calanoid copepod biomass, mean size of calanoid copepods Statistical analysis: Three-mode PCA Results: Major biotic anomalies in the North Sea during the 1990s (start of the change during the 1980s) Beaugrand (in preparation)