Download
1 / 32
320 likes | 508 Vues
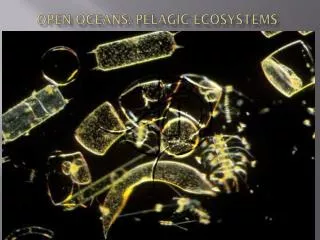
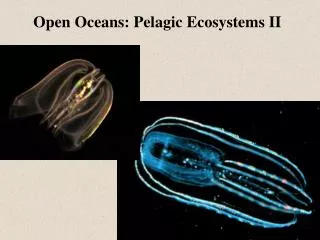
Open Oceans: Pelagic Ecosystems II. Global scale patterns of pelagic productivity. What are controlling processes?. Primary Productivity Different estimates of productivity Gross Primary Productivity Net Primary Productivity Standing crop and Grazing Rates. What is “productivity”?.

E N D
What are controlling processes? • Primary Productivity • Different estimates of productivity • Gross Primary Productivity • Net Primary Productivity • Standing crop • and Grazing Rates
What is “productivity”? • primary productivity is defined as the total quantity of carbon fixed by autotrophs • a rate expressed as grams of carbon fixed per square meter of sea-surface per unit of time • gross primary production is the total amount of organic matter produced by autotrophs • net primary production is the energy remaining after respiratory needs have been met • NPP = Gross Primary Production - Respiration
Questions to consider • Why should we care about patterns of biological productivity in oceans? • What are the spatial patterns of productivity? • What mechanisms promote or limit productivity?
Why should we care about productivity? • Photosynthetic activity in oceans created current O2-rich atmosphere • Plankton form ocean sediments & fossil fuels • Plankton are a critical part of “carbon pump” that influences atmospheric CO2 • Phytoplankton form the base of food webs and associated biological diversity • Limits to productivity may limit the amount of harvestable biomass from ocean ecosystems
Measuring Primary Productivity: Data • Standing crop methods • Chlorophyll concentration (water extraction, satellite) • Cell counts (flow cytometers) • Rate measurements • Light-dark bottle method • Carbon-14 uptake • Advantages & disadvantages
Measuring Primary Productivity: Inferences • Each direct measure of GPP has disadvantages • Computer models integrate different parameters to estimate rates of productivity through the water column and over time • Model components (Field et al. Science 281:237-240) • chlorophyll concentration • water depth in photic zone • fraction of water column where photosynthesis is light-saturated • surface temperature
Some patterns • average primary productivity in the oceans is ~50 g C/m2/yr • 300 g C/m2/yr considered relatively high rate of primary productivity • low rates of primary productivity typically 20 to 30 g C/m2/yr • What accounts for this variation?
Comparing the makeup of water and plankton • Mean Elemental Ratios of N, and P • Organisms: 16.0N / 1P • Sea Water: 14.7N / 1P • On average, seawater lacks sufficient organic N to take advantage of the available phosphorus
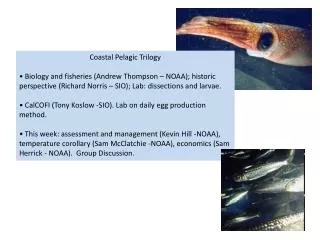
Testing models: measuring plankton in open oceans • Techniques for studying plankton consumers • Plankton levels may be dropping (NASA study)
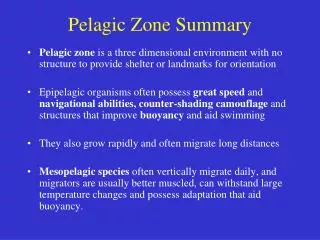
From productivity to food webs: A size-based pelagic food web
Marine “Snow” krill