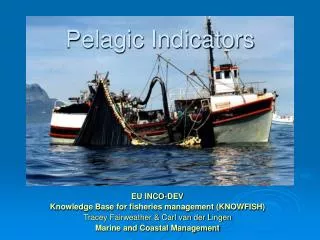
Pelagic Indicators
Pelagic Indicators. EU INCO-DEV Knowledge Base for fisheries management (KNOWFISH) Tracey Fairweather & Carl van der Lingen Marine and Coastal Management. Why do we want indicators?. UNCED (1992) & UN CSD (1994) - Indicators: decision-making in self-regulating system

Pelagic Indicators
E N D
Presentation Transcript
Pelagic Indicators EU INCO-DEV Knowledge Base for fisheries management (KNOWFISH) Tracey Fairweather & Carl van der Lingen Marine and Coastal Management
Why do we want indicators? • UNCED (1992) & UN CSD (1994) - Indicators: • decision-making in self-regulating system • convey crucial technical information to non-technical users • framework for evaluating management • SA committed to WSSD goal of implementing EAF: • quantitative ecosystem indicators & define reference points • integrate ecological, environmental, social & economic perspectives • Challenges: • Selection • Reference points • Communicating • Response time
Fishery overview Catches, products, management… Candidate indicators Selected examples Conclusions Management implications… The SA Pelagic Case Study…
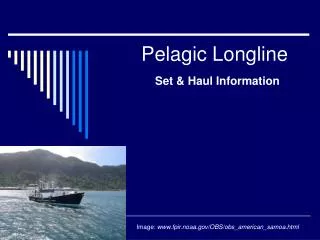
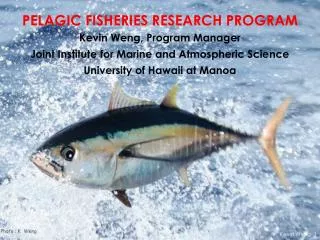
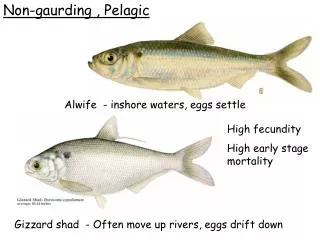
Fish caught using a purse-seine net. Multi-species fishery 3 dominant species >95% of landings Other species: juvenile Cape horse mackerel (maasbanker) chub mackerel lantern fish light fish Fishery Overview anchovy sardine redeye round herring
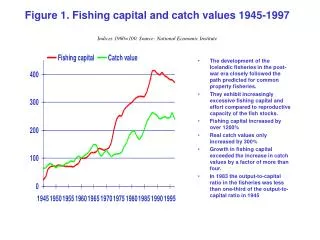
Anchovy Sardine Catch distribution 1987-1998 Catches & Variability • Large volume fishery • avg. ~ 300 000t p.a. • 2004 = 4th consecutive yr landings >500 000t • Sardine catches have steadily increased in the last decade. • Fishing predominantly inshore off the west and southwest coasts. • Small pelagic species are subject to inherent, large-scale fluctuations in population size.
Anchovy are reduced to fish oil and meal (70% caught are recruits ~ 6 months). sardine are canned - pet & human consumption, frozen or used for bait (adult fish). Redeye are reduced to fish oil and meal, some are canned. Value of the fishery ~ R1 billion in 2003. Fishery employs ~ 8 000 workers 5 300 full-time 2 500 part-time 700 sea-going 7100 factory workers SA’s most transformed fishery. Products & Socio-Economics
Fishery independent surveys conducted twice a year recruitment strength (May) spawner biomass (Nov) Hydro-acoustics used to estimate fish biomass. Multi-species fishery = significant by-catch problems. By-catch problem 1: juvenile anchovy & sardine school together. By-catch problem 2: adult sardine & redeye school together. Commercial catches sampled by inspectors, field station personnel and observers. Research & Management
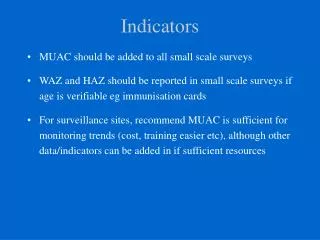
Candidate Indicators • Mean length of catch • Total mortality • Exploitation rate • Ratio of by-catch • Length at 50% maturity • Centre of gravity of catches • Methods from literature • Addressed stakeholder concerns
Length at 50% maturity • L50 documented as declining following heavy exploitation and collapse of the sardine resource and increasing during stock recovery. • Such plasticity could be caused by a number of factors in combination. • Maturity ogives calculated for 5 periods within the time series. • annual sardine L50 & sardine spawner biomass = highly significant positive correlation (R2=0. 452, p<0.01, n=49).
L50 • Each moving average data series for sardine provided increasingly better fits: • 3yr R2=0.575 (0.715 polynomial) • 5yr R2=0.729 (0.818 polynomial) • 7yr R2=0.821 (0.870 polynomial) • Anchovy data collected during annual fisheries independent surveys since 1984. • Annual anchovy L50 has no correlation (R2=0.008) to spawner biomass est. • Shorter-lived species = less maneuverability in age at maturity. • This indicator will be of limited use for monitoring anchovy. But suggested descriptive indicator for sardine.
estimated separately for each of 3 target fisheries: anchovy, sardine & redeye. RsBA & RRBA will be discussed. RsBA = mainly juvenile sardine. NB management issue. RsBA & ratio of sardine SB to anchovy SB = strong correlation R2=0.791 & p<0.01 Redeye by-catch Sardine by-catch RxBi Proportion of By-catch • RRBA = mainly juvenile redeye. • Similar pattern to RSBA • RRBA & ratio redeye SB to anchovy SB = strong correlation • R2=0.682 & p<0.01 • RsBA & RRBA can be used as descriptive indicators.
RxBi – Management Implications • Flowcharts intro in 1998 for catch categorization (adult TL>16.5cm). Revised in 2003 (adult TL>14cm). • Given the annual L50 – only 16% of sardine directed catch (RSBS) should be considered adult. • Given TL cut off – 71% of sardine by-catch (RSBA) should be considered adult sardine, NOT juvenile. • Given the annual L50 – only 12% of RSBR should be considered adult. • These results contradict what is known about the fishery.
Sardine Z calculated using von Bertalanffy parameters. Sardine E < 0.4 Sardine E not correlated to biomass. But sardine biomass has increased steadily since 1984. Conclude: sardine management successful. Target reference point E*=0.4 F=C/N & is assumed to include discards. Exploitation rate = F/Z • Anchovy Z derived from ecosystem model. • Anchovy E <0.4 • Anchovy E weakly correlated to biomass • Anchovy biomass has also increased since 1984. • E = effective performance indicator for both species.
ECO-UP Centre of gravity • To determine changes in the geographical location of catches between years. • Centre of gravity = centroid + axes showing extent of CV. • A centroid is the weighted mean location (longitude ; latitude) of catches for a year. • Centroids of commercial catches of anchovy, sardine by-catch and directed sardine were calculated. • The majority of catches are taken close inshore between Saldanha Bay and Gans Bay. • The coastline and commercial catch position information was linearised to aid interpretation of this indicator.
ECO-UP Annual Catch
Conclusions… Few indicators were applicable to anchovy for two main reasons: the logistics of data collection and the implications of being a short-lived particularly small pelagic fish.
Can we incorporate KNOWFISH indicators into management ? • Determine appropriate suite of indicators for management using refined selection criteria from a rigorous scoring procedure, e.g.: • Rochet and Rice 2005: concreteness, theoretical basis, public awareness, cost, measurement, availability of historic data, sensitivity, responsiveness, specificity. • Degnbol & Jarre 2004: acceptability among stakeholders, observability, relation to fisheries management (traffic light approach). • Assess if indicators are redundant, consider cost and ease of translation into practical management measures. • Where possible, these indicators will be incorporated into Pelagic fisheries management in the coming year.