Download
1 / 12
120 likes | 242 Vues
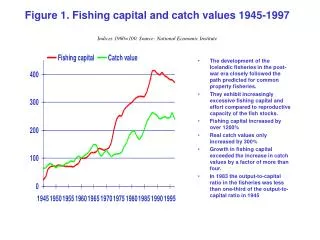
Figure 1. Fishing capital and catch values 1945-1997 Indices 1960=100. Source: National Economic Institute. The development of the Icelandic fisheries in the post-war era closely followed the path predicted for common property fisheries.

E N D
Figure 1. Fishing capital and catch values 1945-1997Indices 1960=100. Source: National Economic Institute • The development of the Icelandic fisheries in the post-war era closely followed the path predicted for common property fisheries. • They exhibit increasingly excessive fishing capital and effort compared to reproductive capacity of the fish stocks. • Fishing capital increased by over 1200% • Real catch values only increased by 300% • Growth in fishing capital exceeded the increase in catch values by a factor of more than four. • In 1983 the output-to-capital ratio in the fisheries was less than one-third of the output-to-capital ratio in 1945
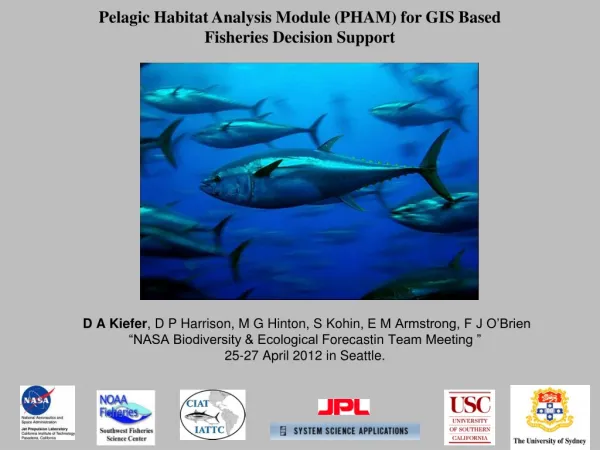
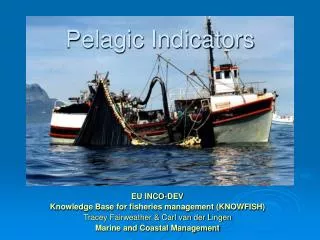
Herring fishery TAC in the herring fishery in late 60’s TAC did not halt the decline in the stocks A complete herring moratorium in 1972 Herring fishery partly resumed inn 1975 Vessel quota (IQ) system with limited eligibility Vessel quotas were small, issued for a single season at a time Transfers of quotas between vessels allowed in 1979 Various political decisions on entry and exit (eligibility) until the mid 80’s The Fisheries Management Act of 1990 made the vessel quota system in the herring fishery part of the general ITQ system Capelin fishery Became important in the 1970’s Vessel quotas in 1980, at a time when the stock was seriously threatened with overfishing. The arguments were much the same as in the herring fishery previously The industry asked for limited entry into the capelin fishery and vessel quotas In 1986 capelin vessel quotas became transferable The capelin vessel quota system became a part of the general ITQ system with the adoption of the Fisheries Management Act of 1990 The Pelagic Fisheries
200 mile exclusive fishing zone in 1976 MRI recommends TAC for codfish TAC proved difficult to uphold Individual effort restrictions in 1977 Limited allowed fishing days for each vessel New entry remained possible and the demersal fleet continued to grow Allowable fishing days had to be reduced from year to year. Deep-sea trawlers were allowed to fish for cod 323 days in 1977 In 1981 they were allowed 215 days This system was economically wasteful Sharp drop in the demersal stock and catch levels in 1983-84 The Fisheries Association of Iceland proposes IQs in the demersal fisheries for 1984 IQ system extended for 1985, 1986-1987, 1988-1990 Vessels allowed to opt for effort restrictions, to ensure sufficient support In 1990 a comprehensive ITQ legislation, the Fisheries Management Act This legislation abolished the effort quota option and closed certain other loopholes. Extended the ITQ system indefinitely Demersal Fisheries
The size of each vessel’s annual catch entitlement (ACE) in a specific fishery is a simple multiple of the TAC for that fishery and the vessel’s TAC share The ITQ system was superimposed on an earlier management system The system involving certain gear, area and fish size restrictions is still largely in place. The ITQ system has not replaced these components of the earlier fisheries management system The Fisheries Management Act of 1990 has been amended on several occasions (in 1992, 1994, 1995, 1996, 1997, and 1998) System made fairly uniform across the various fisheries by the Fisheries Management Act of 1990 Slight differences between the fisheries exist, mostly for historical reasons The fisheries management system is based on individual transferable quotas (ITQs) and fishing licences All fisheries are subject to vessel catch quotas: 15 species in Icelandic waters and 3 outside The quotas represent shares in the TAC They are permanent (indefinite), perfectly divisible and fairly freely transferable They are issued subject to a small annual charge to cover enforcement costs The current ITQ Fisheries Management System
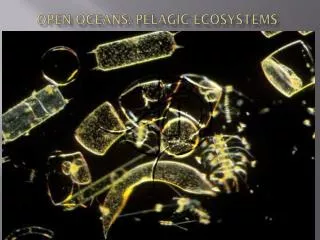
Performance of the ITQ SystemPelagic Fisheries • Figure 3. The Development of the Pelagic Fishery 1977-1997 • Max. no. of active purse seine vessels in any one month • ITQs in herring and capelin successful • By 1993-1994 number of vessels declined by a third in each fishery • Increasing catches • Catch per unit effort in herring increased tenfold • Herring stock in good condition • Capelin stock more volatile do to natural factors • Good profitability in capelin fishery
Pelagic Fishery • Figure 2. The Pelagic Fishery CPUF for the purse seine fleet • Herring and capelin quotas combined on fewer vessels • Pelagic fishery season extended • Icelandic herring in Autumn • Capelin in Winter • Norse herring in early Summer • Capelin in late Summer • Many vessels have deep-sea shrimp quotas • Vessels changed for trawl fishing and on board processing
Demersal Fisheries • Figure 4. Demersal fishing effort and capital 1978-1997 • Indices 1979=100 • IQs in 1984 • Effort restrictions dominant in 1985-1990 • Vessels under 10 GRT exempt from quotas • Investment in small boats • Processor vessels • Comprehensive ITQ System since 1991 • Fishing effort decreased substantially • Fishing capital growth halted, and from 1992 decreased somewhat Effort Restrictions ITQ System Effort Restrictions Dominant
Figure 5. Number of vessels with commercial fishing permits 1992-1998 • Number of vessels with commercial permits 2,552 in 1992/93 • Down to 1,695 in 1998 • In 1992: 1,265 vessels larger than 6 GRT with TAC shares • In 1998: 798 • In 1992: 1,125 vessels under 6 GRT engaged in hook and line fishing • In 1998: 808 • Inshore shrimp fisheries:50 to 44, scallop fishery: 21 to 15, and lobster fishery: 57 to 42