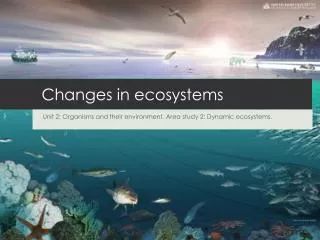
Open Oceans: Pelagic Ecosystems
Open Oceans: Pelagic Ecosystems. Bacterioplankton. Elements of an Ecosystem Approach. What are the components ? What are the special environmental challenges ? What are the special adaptations ? How do we understand form & function ? What are the controlling processes ?

Open Oceans: Pelagic Ecosystems
E N D
Presentation Transcript
Elements of an Ecosystem Approach • What are the components? • What are the special environmental challenges? • What are the special adaptations? • How do we understand form & function? • What are the controlling processes? • What are the important patterns?
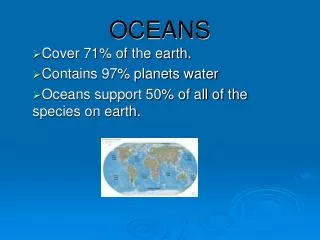
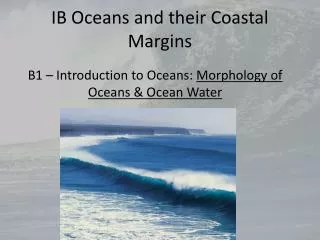
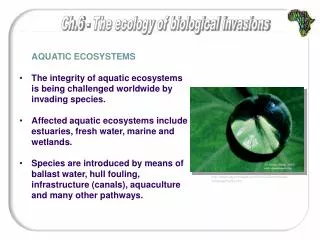
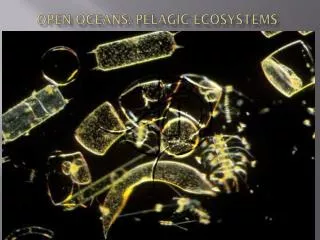
Pelagic System Components • The area of open water of oceans, including the entire water column away from the bottom substrates • Nutrients and salts • Plankton • Nekton
Dimensions of Variation for Plankton • Size: virus (2 x 10⁻⁷ m) to jellyfish (0.2 m) • Energy processing & nutritional modes • photosynthetic (phytoplankton) • heterotrophic, ingestive (zooplankton) • heterotrophic, absorptive (mycoplankton) • infective (viroplankton) • Life history variation • permanent residents • transient members of the plankton community
Phytoplankton Diatoms Foraminifera Dinoflagellates
Mixture of groups producing a “bloom” Baltic Sea 1 Coccolithophores 2 Diatoms 3 Eukaryotic picoplankton
Challenges • Maintaining access to nutrients, light, & resources • Avoid being food for larger consumers
Adaptations for maintaining position • Use water movements • Convection cells (from diurnal cycles in heat) • Langmuir convection cells from wind
Adaptations for maintaining position • Affect buoyancy • Use lighter ions for osmotic balance (e.g., use chlorides rather than sulphates) • Develop flotation organs (gas, oils, fats) • Manipulate resistance (use viscosity) • “parachute” morphology • elaborate appendages
What are controlling processes? • Primary Productivity • Different estimates of productivity • Gross Primary Productivity • Net Primary Productivity • Standing crop • and Grazing Rates
What is “productivity”? • primary productivity is defined as the total quantity of carbon fixed by autotrophs • a rate expressed as grams of carbon fixed per square meter of sea-surface per unit of time • gross primary production is the total amount of organic matter produced by autotrophs • net primary production is the energy remaining after respiratory needs have been met • NPP = Gross Primary Production - Respiration
Questions to consider • Why should we care about patterns of biological productivity in oceans? • What are the spatial patterns of productivity? • What mechanisms promote or limit productivity?
Why should we care about productivity? • Photosynthetic activity in oceans created current O2-rich atmosphere • Plankton form ocean sediments & fossil fuels • Plankton are a critical part of “carbon pump” that influences atmospheric CO2 • Phytoplankton form the base of food webs and associated biological diversity • Limits to productivity may limit the amount of harvestable biomass from ocean ecosystems
Measuring Primary Productivity: Data • Standing crop methods • Chlorophyll concentration (water extraction, satellite) • Cell counts (flow cytometers) • Rate measurements • Light-dark bottle method • Carbon-14 uptake • Advantages & disadvantages
Measuring Primary Productivity: Inferences • Simple models integrate different parameters to estimate rates of productivity • Model components (Field et al. Science 281:237-240) • chlorophyll concentration • water depth in photic zone • fraction of water column where photosynthesis is light-saturated • surface temperature
Some patterns • average primary productivity in the oceans is ~50 g C/m2/yr • 300 g C/m2/yr considered relatively high rate of primary productivity • low rates of primary productivity typically 20 to 30 g C/m2/yr