Download
1 / 23
230 likes | 555 Vues
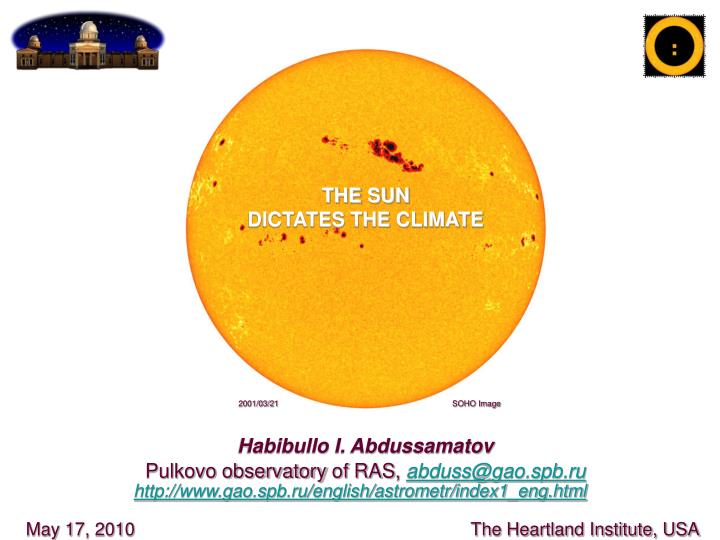
THE SUN DICTATES THE CLIMATE. 2001/03/21. SOHO Image. Habibullo I. Abdussamatov Pulkovo observatory of RAS , abduss@gao.spb.ru http://www.gao.spb.ru/english/astrometr/index1_eng.html

E N D
THE SUN DICTATES THE CLIMATE 2001/03/21 SOHO Image Habibullo I. Abdussamatov Pulkovo observatoryof RAS, abduss@gao.spb.ru http://www.gao.spb.ru/english/astrometr/index1_eng.html May 17, 2010 The Heartland Institute, USA
Significant variations in the average annual values of the total solar irradiance (TSI) caused by the variationsin the shape of the Earth orbit and in the direction of the rotational axis of the Earth —by Milankovitch cycles together withsecondary subsequent feedback effectsleadto theBig glacial periods (~100,000 years), established within the last 850,000 years (even if the solar luminosity Lremains constant). TSI is defined as S= L/4πA2, where L– the solar luminosity— the total energy of the Sun output (per unit time) in the form of electromagnetic radiation, S– the total solar irradiance at the average annual distance of the Earth orsolar constant, A – the average annual distance between the Sun and the Earth.
Slightvariations in the average annual valuesof the TSI caused bythemovementoftheSunin relationtothecenterofmassoftheSolarSystem and corresponding variations in the average annualdistance between the Sun and the Earthleadtoshorter slight variations in the climate(even if the solar luminosity Lremains constant). The Earth and other planets are moving in relation tothecenterofmassoftheSolarSystem.
Natural bicentennialvariations in the average annual valuesof the TSI causedby cyclic variations in the radius of the Sun together with secondary subsequent feedback effectsled to 18 Little Ice Ages, established within the last 7500 years.Every time the TSI experienced its peak(up to 0.2%) a global warming began with a time lag of 15±6 yearsdefined by the thermal inertia of the Ocean (despite the absence of anthropogenic influence) and each deep bicentennial descent in the TSI caused a Little Ice Age. The common sign of the cyclic bicentennial climate change isdependence of the average global temperature on both the direct influence of the bicentennial variation in the TSI(approximately in half)and (approximately in half)on the secondary subsequentfeedback effects (natural changes in the albedo, water vapour abundance, etc.) caused by it. The influence of feedback effects introduces a kind of chain reaction growth into a climate change even if the growth of TSI ceases.
The total solar irradiance is determined bytherelationship: A cyclical change in the TSI is expressed thus: Such a change occurs as a result of the complex processes in the interior of the Sun. A smooth change in the temperature of surface layer leads to the disruption of hydrostatic equilibrium (the balance between internal pressure and gravity). Restoration of thermodynamic equilibrium can be achieved through a change in the size of the Sun to that value which restores balance; specifically, restores the temperature of the surface to the previous level, such thatΔTeff= 0, thus thefollowing relationship is valid: ΔR = k·ΔS, where k = R/2S = 255 km/(Wm–2). Variationsinthe TSI occuras a resultoffluctuationsintheradius of the Sunwithanamplitudeof up to 250 kmwithinthe 11-year cycle, andupto 700 kmwithinthebicentennial cycle.
The established rule: the bicentennial and 11-year cyclicalvariationsin the TSI, sunspot activityandsolar radiusare synchronized and cross-correlated both in phase and amplitude allows one to use relatively short time series of the precision measurements of the TSI matching them to the prolonged series of the sunspot activity. It enables one to study the course of TSI during the past centuries and even millennia to match it to the corresponding climate changes in the past and to study its future variations. Cyclical variations of the solar activity being the accompanying phenomena of the physical processes occurring in the interior of the Sun don’t substantially affect both TSI and terrestrial climate.
Positivecorrelationbetweenthesolarradiusandsunspotnumber variationsinboth phaseandamplitude (1631–1973) from the analysisof internalcontacttimingsforthe transitsofMercury acrossthesolardiskover 1631–1973(Sveshnikov M.L.Astronomy Letters. 2002, 28, 115)
Dependenceof 11-year solaractivitycyclesduration(forthecycles 10–23) on thephaseof a bicentennial cycle ( – cycle 23)
Variationsin the TSI(daily data are takenfromwww.pmodwrc.ch/pmod.php?topic=tsi/composite/SolarConstant) andsunspotnumber(monthly data takenfromhttp://sidc.oma.be/sunspot-data/) Average of the TSI for the cycle 23 is 0.17 Wm-2less than for the cycle 22. The smoothed value of the TSI in the minima of the cycles 23/24 was 0.25 and 0.32Wm-2less than in the minima of the cycles 22/23 and 21/22 respectively.
We expect thebeginning of the new LittleIceAge epochapproximately in 2014. Annual average TSIexperiences accelerated decrease since the 1990s. In 1998–2005 the Earth reached the maximum of the global warming.
TSIhas reached its record for the last (at least) 700 years. TSI variations(using the reconstructed data:Lean J.L.Space Sci. Rev. 94, 39, 2000; Solanki S.K., Krivova N.A. Solar Phys. 224, 197, 2004;Avdyushin S.I., Danilov A.D. Geomagnetizm i aeronomiya. 40, 3, 2000)andsolar activityvariations since 1611(http://sidc.oma.be/sunspot-data/). The forecastoftheirchangesafter 2009is shown by dashlines (Abdussamatov H. I.The Sun dictates the climate of the Earth. 2009, St. Petersburg, “Logos”, –197 p.)
The received solar energy has to be compensated by the energy that leaves the Earth for the climate to be stable. Any prolonged increase in the TSIremains uncompensated by the energy radiated by the Earth during 15±6years due to the thermal inertia of the Ocean.Thisleads to the sequentialaccumulation of the solar energy by the Ocean and to the gradual increase in the global temperature. Annual averageofthe TSI experiences accelerated descentsincethe 1990s. We are going through the period of unstable variations when tillthe 2014 the global temperature will oscillate around the maximumreached in 1998-2005, then a new Little Ice Age will come. We expect thebeginning of the new LittleIceAge epochin 2014. In 2003-2005 I predicted a new deep minimum of both TSI and sunspot activity in 2042±11 with a deep global temperature minimum in 2055-2060(±11)andmy predictions are looking better and better with each passing year.
The increase in the temperature causes the fall of albedo and the rise of the water vapour abundance etc. in the surface air. These changes lead to the additional chain reaction growth of the global temperature due to the sequential repeats of the mentioned changes. In the last quarter of the XX century the value of TSI changed insignificantly but due to the regular decrease in the albedo (since 1984 to 2000 (Pallé E.et al. Science.2004, 304, 1299)) and due to the rise of the water vapour abundance in the surface air caused by the global warming the global temperature continued to increase. That is why the climatic changes on the planet in the last quarter of the 20th century were going onandon without a glance back to the Sun.
The forecast of the natural climate change for the nearest 100 years
Sensitivity of climate to carbon dioxide abundance dropped with the increase of water vapour concentration The changes in the concentrations of water vapour and carbon dioxide with height. Regions with essential re-covering of water vapour and carbon dioxide spectral details. It is obvious that water vapour concentration varies substantially with height. Even small increase in the average water vapour abundance canincrease surface air concentration significantly. This leads to considerable changes in radiative transfer. Abdussamatov H.I., Mushtukov A.A. (in press)
We have computed spectral changes with variable water vapour concentration within 7% and carbon dioxide abundance within350 to 420 ppm. Cloudiness was fixed in our calculations. We have found that climate sensitivity to carbon dioxide dropped with the increase of water vapourconcentration. Abdussamatov H.I., Mushtukov A.A. (in press)
The well-knownannual average global temperature (in relation to the temperature of 1961-1990) and carbon dioxide abundance in 1998-2008 and their expected variations in 2009-2015
Petit J.R. et al. // Nature, 1999. 399, 429; http//www.daviesand.com/Choices/Precautionary_Planning/New_Data/
We have developed the dedicated Russian-Ukrainian project Astrometria on the Russian Segment of ISS. The project will focus on the high precision photometric and coordinate measurements of temporal variations in the shape and diameter of the solar disc. The project will give us a possibility to measure the value of TSI and its temporal variations with a significantly higher precision during 6 years.The received data on TSI variations can be extrapolated to the past and future. If the Astrometria project is implemented in time, we will be able to develop a more precise forecast of the duration and depth of the approaching new Little Ice Age and to understand the reasons of cyclical changes taking place in the interior of the Sun and the ways they affect the Earth and various scopes of human activity.
Thus the long-term variations in the amount of solar energy reaching the Earth are the main and principal reasons driving and defining the whole mechanism of climatic changes from the global warmings to the Little Ice Ages and Big glacial periods. Resulting subsequent secondary feedback effects(natural changes in albedo, water vapour abundance, etc.)will additionally increase theglobal climate change by a value comparable to the effect of the incoming solar energy variations alone or even more(proportionally to the duration of these variations)even if the annual average of the incoming solar energy then remains constant for an extended period of time. The global warming in the Solar System excludes the responsibility of humans for the global warming observed on the Earth throughout the 20th century.
The use of practically full identification of the climate changes with the variations in the incoming solar energy(taking into account their direct and subsequent secondary feedback influences)within a climate model gives a sufficiently precise reconstruction of climatic processes taking place in the past and nearest future. _____________ The climatic changes are not under the control of human and the climate changes are independent from behavior, actions and desires of the mankind. A reasonable way to combat these changes is to maintain economical growth in order to adapt to the upcoming new Little Ice Age in the middle of the XXI century.