Download
1 / 39
400 likes | 550 Vues
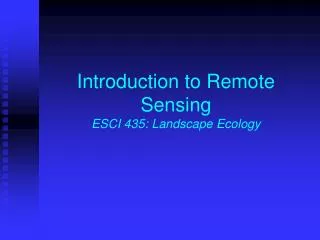
Introduction to Remote Sensing ESCI 435: Landscape Ecology. What color is my shirt?. What color is my shirt? What does this really mean?. The Electromagnetic Spectrum. μm = micrometer = 10 -6 meters The micrometer is the most common unit used to quantify the wavelength of EM energy.

E N D
The Electromagnetic Spectrum μm = micrometer = 10-6 meters The micrometer is the most common unit used to quantify the wavelength of EM energy Lillesand and Kiefer
Interactions of EM energy with earth surface features • λ the greek letter “lambda” is the symbol for wavelength • This figure is really a statement about the First Law of Thermodynamics. You will recall that this law deals with the conservation of energy. • All incident EM energy of a particular wavelength, λ, will be partitioned among reflection, transmission and absorption. • This basic principle hold for solids, liquids and gases. Lillesand and Kiefer
Spectral Reflectance Curves • The % of incident energy that is reflected from an object usually varies as a function of wavelength. • This variation can be displayed in the form of a spectral reflectance curve. • This wavelength dependent variation in reflectance is the basis for making inferences about the properties of different earth surface features and distinguishing between different cover types. Visible portion of EM spectrum Lillesand and Kiefer
Practical Experience with Remote Sensing: Vision • Your eyes are extraordinarily effective remote sensing devices. • Each of you have 20+ years of experience using “data” generated by your eyes to make inferences about the world around you • Color, texture and context provide valuable clues • Your eyes gather data using only the visible part of the EM spectrum • The field of remote sensing involves the use various sensors to extend your ability to monitor the world around you
Remote Sensing: Defined • General: “..it is the art or science of telling something about an object without being in direct contact with it.” (Fisher et al. 1976; from Table 1.1 of your text)
Remote Sensing: Defined • More specific: “Remote sensing is the practice of deriving information about the earth’s land and water surface using images acquired from an overhead perspective, using electromagnetic radiation in one or more regions of the electromagnetic spectrum, reflected or emitted from the earth’s surface.” (Campbell)
Remote Sensing: Defined • More cynical? More fun? More accurate?“Remote sensing is the art of dividing up the world into multicolored squares and then playing endless computer games with them to release unbelievable potential that is always just out of reach.”
Milestones in Remote Sensing • 1920-30: routine use of aerial photos by various government agencies • 1939-45: WWII and the development and use of Infrared film. Unlike conventional film, IR film is sensitive to EM energy in the near Infrared portion of the EM spectrum. Why might this be useful during wartime?
Spectral Reflectance Curves: What are the unique features of vegetation? • Vegetation is “dark” (low reflectance) in the visible part of the spectrum and very bright in the near IR Lillesand and Kiefer
Kodak advertisement circa 1943: two photographs using conventional film N. Short tutorial
The same site with Infrared film N. Short tutorial IR film is also referred to as “Camouflage Detection” or CD film
Another example of IR film Standard color film Color IR film Do you see anything odd? Lillesand & Kiefer Fig 2.27
Milestones in Remote Sensing • Post WWII: Extensive use of air photos (conventional and IR) during war spilled over into extensive civilian applications after the war. • 1950s: extensive application of IR film to agricultural monitoring • 1950-60: Extensive R&D by military on use of RS for intelligence gathering. This was done in secret but older technology made its way into the civilian sector. • 1960s: lots of developments, including First moves from photographic to digital multispectral scanners. This facilitates the move away from subjective photointerpretation to more objective statistically based image classification.
Milestones in Remote Sensing • 1972: The launch of the Earth Resources Technology Satellite (ERTS-A); later renamed LANDSAT I. This was the first satellite dedicated to civilian remote sensing. • A fork in the road: civilian and military RS head in different directions.
Milestones in Remote Sensing • Launch of Landsat I represented a fork in the road: civilian and military RS head in different directions • Civilian RS: moderate spatial resolution sensors and a focus on “regional” studies. A standard Landsat scene is 185 km X 185 km. Great for things like crop monitoring. • Military RS: focus on very high spatial resolution. Imagery of planes, military installations etc.
Milestones in Remote Sensing • 1970s: lots of basic research in RS and lots of new applications for Landsat data. Launch of Landsat 2 and 3 to keep up with demand. Modest improvements with each launch.
Milestones in Remote Sensing • 1980s: Two parallel lines of development: • Improved sensor for Landsat 4; the Thematic Mapper (TM) that was optimized for vegetation RS based on basic research done during the 1970s • Delays in development of Landsat 4 suggested that there might be a window during which there would be no operational Landsat. • This lead to “discovery” that operational meteorological satellites could be used for vegetation RS
Milestones in Remote Sensing • 1980s: (continued): NOAA meteorological satellites have very low spatial resolution (1-4km vs. 30-80m for the sensors carried by Landsat) but this also enables them to image much larger areas (swath width of over 2000km vs. 185 km for Landsat). Data from these sensors can be used to address different questions, especially those related to global climate change
Milestones in Remote Sensing • Mid-1980s: Hyperspectral data; measurements in hundreds of very narrow parts of the EM spectrum. All previous sensors take measurements in 3-7 broad portions of the spectrum. Hyperspectral data are particularly useful for geological applications. Airborne only at this time. Some newer satellites now provide measurements in about 30-40 bands. • Privatization of Landsat: creation of EOSAT, now called Space Imaging. 10X increase in cost of imagery to users.
Milestones in Remote Sensing: Current status of Landsat • Landsat 4 and 5 launched in 1982 and 84 respectively; designed to operate for 3 years. • EOSAT pledged to fund Landsat 6 • Landsat 6 finally launched in 1993: It crashed. • Privatization of Landsat widely viewed as a failure • Mid-1990s: NASA takes back Landsat; Space Imaging continues to market older imagery; NASA launches Landsat 7 in 1999.
Milestones in Remote Sensing: Current status of Landsat • Mid-1990s: NASA takes back Landsat; Space Imaging continues to market older imagery; NASA launches Landsat 7 in 1999. • Landsat 5 continued to operate until Landsat 7 became operational. It worked for 15 years! 12 years beyond its designed lifespan! • Landsat 7: Modest improvements over Landsat 5. Fed govt manages; committed to maintaining system for decades
The Future of Remote Sensing? • The Earth Observing System (EOS) era: lots of new sensors (15m-5km spatial resolution) • Commercial Remote Sensing finds a niche: high spatial resolution data (0.6-4m); IKONOS, Quickbird, others • LIDAR
The metamorphosis of a Remote Sensing Scientist • Up until the 1980s, the field of RS was dominated by engineers and physicists • 1970s: RS scientists began to talk to agronomy departments; first practical applications of RS were in agriculture. Crops are an ideal “target” (single species, uniform spacing, etc.) • 1980s: RS scientists began to talk to ecologists; application of RS to “natural” plant communites; no more single species stands, much more difficult! First real “ground truth”
The metamorphosis of a Remote Sensing Scientist: Costs melt away • 1980s: It took at least a half million dollars worth of hardware, customized software and several full-time programmers to do RS • By the early 1990s: $5000-10,000 worth of hardware (UNIX or PCs) and commercially available software made it possible for a much wider array of scientists from a much wider array of fields to get involved with RS. • 2000: lots of free imagery, cheap computers and software • Wide use of RS in archeology, agriculture, forestry, geography, environmental science, ecology, oceanography, geology and many others.
Where are we now? Good news and bad news. • Wide use of RS in archeology, agriculture, forestry, geography, environmental science, ecology, oceanography, geology and many others. • Low cost and high availability of RS imagery means that many people are using these data without any understanding of what they are doing. Lots of misuse! • RS is more than eyeballing pretty pictures! • Training is needed to insure proper use of these data.
Elements of Resolution • Spatial resolution: smallest entity on the ground that can be examined by the sensor; the “pixel size” or grid cell size. • Temporal resolution: how frequently can the sensor obtain repeat coverage of a given location? (e.g., daily, monthly) • Spectral resolution: the number of different portions of the EM spectrum that can be simultaneously monitored by the sensor • Radiometric resolution: the number of “shades of gray” a sensor can recognize
1100m 80m 30m 15m 20m 10m Lillesand & Kiefer
High Spatial Resolution Satellites: a Niche for Commercial Remote Sensing • IKONOS (Space Imaging) • Launched Sept. 1999 • 1m Panchromatic: 0.45 – 0.90 µm • 4m multispectral: 0.45-0.52, 0.52-0.60, 0.63-0.69, 0.76-0.90 µm (same as TM bands #1-4) • Swath width 13km • Revisit freq: 2.9 days with off-nadir pointing (up to 26 degrees • Cost of about $80/square mile
The cost of high spatial resolution: very high data volumes! • Sometimes less is more. How many pixels does it take to cover a hypothetical study area of 100km by 100km? • This is the minimum number of individual data values that would be required for each band! • High data volume incurs a high cost for both storage and processing • Low spatial resolution makes it practical to study larger spatial extents; e.g. global rather than regional
Other Coarse-resolution Sensors • Moderate Resolution Imaging Spectrometer (MODIS): a key instrument on TERRA, part of the Earth Observing System (EOS)
MODIS • Two in operation (on EOS-AM and EOS-PM) launched in 1999 and 2002, respectively • 36 spectral bands from 0.4-14.4 µm • 2 bands at 250m resolution • 5 bands at 500m resolution • 29 bands at 1km resolution • Radiometric resolution: 12-bit • 2300km swath width • 1-2 day repeat cycle http://modis.gsfc.nasa.gov/about/design.html
Summary: 3 broad categories of spatial resolution available • High resolution (0.6-4m) • IKONOS, Quickbird, Orbview • expensive! • Moderate (10-80m) • MSS, TM, SPOT, Aster • Free to cheap • Low (250m – 4km) • AVHRR, MODIS • Free to cheap
The Electromagnetic Spectrum μm = micrometer = 10-6 meters The micrometer is the most common unit used to quantify the wavelength of EM energy