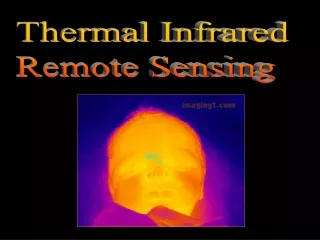
Remote Sensing Thermal Remote Sensing
Remote Sensing Thermal Remote Sensing. 1. Review of Radiation Laws. All objects at temperature above absolute 0 o K emit (-273.59 o C, -459.67 o F) Stefan-Boltzmann law: W = s T 4 W-total emitted radiation s -a constant, T-temperature in o K

Remote Sensing Thermal Remote Sensing
E N D
Presentation Transcript
1. Review of Radiation Laws • All objects at temperature above absolute 0oK emit (-273.59oC, -459.67oF) • Stefan-Boltzmann law: W = sT4 W-total emitted radiation s-a constant, T-temperature in oK • The total emitted radiation from a blackbody is proportional to the fourth power of its absolute temperature
Radiation Laws • Wien's displacement law: l = 2,897.8/T l-peak wavelength, T-temperature in oK • As temperature of objects increases, the wavelength of peak emittance becomes shorter
Radiation Laws • Emissivity: e = M/Mb e-emissivity M-emittance of a given object Mb-emittance of blackbody e = 1 (blackbody) e = 0 (whitebody, perfect reflector) • The ratio between the emittance of a given object and that of blackbody at the same temperature
Emissivity of Common Materials Dry mineral soil 0.92-0.94 paint 0.90-0.96 Dry vegetation 0.88-0.94 Dry snow 0.85-0.90 Granite rock 0.83-0.87 Glass 0.77-0.81 Sheet iron (rusted) 0.63-0.70 Polished metals 0.16-0.21 Aluminum foil 0.03-0.07 Highly polished gold 0.02-0.03 Clear water 0.98-0.99 Wet snow 0.98-0.99 Human skin 0.97-0.99 Rough ice 0.97-0.98 Vegetation 0.96-0.99 Wet soil 0.95-0.98 Asphalt concrete 0.94-0.97 Brick 0.93-0.94 Wood 0.93-0.94 Basalt rock 0.92-0.96
2. Heat • Kinetic temperature • Radiant temperature • Heat capacity • Specific heat • Thermal conductivity
Heat .. • Kinetic temperature (oF oC oK) - thermal energy of molecules within a substance • Radiant temperature - the emitted energy
Heat .. • Heat capacity C (cal·g-1·oC-1) - the ratio of the change in heat energy per unit mass to the corresponding change in temperature at constant pressure • Water has a higher heat capacity than many other materials
Heat .. • It takes more energy for water to warm up to the same temperature than many other materials do • Rank of heat capacity Water > forest > grass > land • In other words, for a given amount of energy, water warms up slower than many other materials
Heat .. • Specific heat - the ratio of the heat capacity of a substance to that of a reference substance, i.e. pure water • Specific heat of water = 1 Specific heat for many other materials < 1
Heat .. • Thermal conductivity K (cal·cm-1 ·sec-1·oC-1) - the rate at that a substance transfers heat • Water has a lower K value than many other materials • It takes a longer time for water to transfer heat over a given distance than many other materials
3. Geometry of Thermal Images • Tangential scale distortion - caused by varied viewing distance • Aircraft instability - roll: side by side motion - crab (yaw): by compensating drift - pitch: head/tail motion
Geometry of Thermal Images • Relief displacement - differs from that of aerial photography - vertical features on thermal images displaced from the nadir for each scan - vertical features on air photo displaced radially from the principal point
4. Thermal Image Interpretation • Limitations - thermal images contain noise and errors - differences in emitted energy is not directly related to differences in temperature, must know emissivity of each material - sensors only record the radiance at the surface
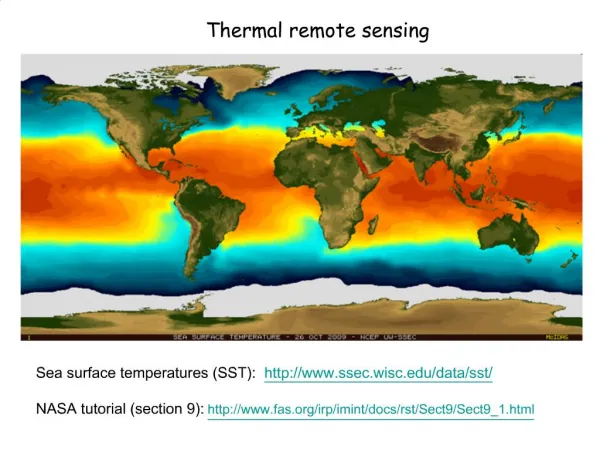
Color-coded temperature maps derived from NIMBUS http://rst.gsfc.nasa.gov/Sect14/Sect14_4.html
Landsat band 6 full scene acquired at 9:32 P.M. on August 22, 1982
Thermal Image Interpretation • Landscape factors • Timing
Thermal Image Interpretation • Landscape factors - surface material: land vs. water - topography: sunlit vs. shadowed - vegetation cover: land, grass, forest, water - moisture
Thermal Image Interpretation • Timing Early afternoon: - high thermal contrast but with thermal shadow and slope orientation effects - water is cool; bare soil, meadow and forest are warmer
Thermal Image Interpretation • Timing Before dawn: - lower thermal contrast but little slope orientation effects or thermal shadow - water is warm; open meadow and bare soil are cool, forests are warm
Thermal Image Interpretation .. • Radiant temperature fluctuates less for water than for many other materials due to its high heat capacity • Radiant temperature peaks later for water than for many other materials due to its high heat capacity
Readings • Chapter 5