Download

1 / 38
380 likes | 404 Vues
This journey explores the concept and applications of spatial microsimulation, a technique used to create simulated data that combines various datasets to analyze wealth and health variations. The power of spatial microsimulation in policy scenarios and future research is discussed.

E N D
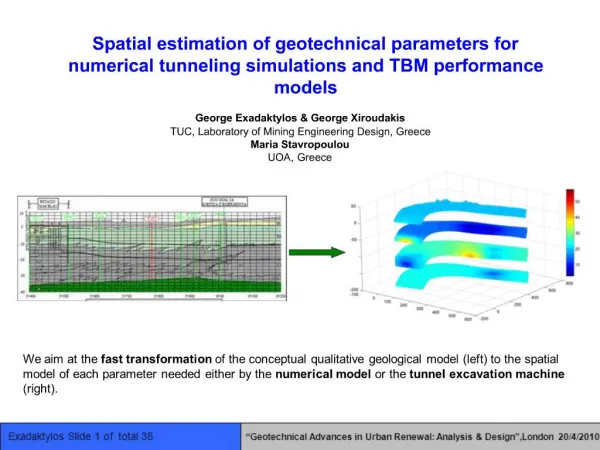
Spatial microsimulation approach: A journey of explanation and exploration! Dr Malcolm Campbell Director Geohealth Laboratory and Department of Geography, University of Canterbury, Christchurch, NZ
Contents • What is Microsimulation? • Why might it be useful and policy relevant? • How does Microsimulation help illuminate wealth and health variations? • The power of using Spatial Microsimulation • Policy scenarios • Future research • Questions and discussion
Some assumptions • You are here because you are interested • (bold assumption!) • You should see the usefulness of microsimulation from some of the examples to follow? • (or I am in trouble?) • A basic grasp of stats? • (or you are in trouble?) • You may already have some ideas about how microsimulation could be used? • I am going to try and cover a wide range of areas and use maps – because geography matters! • Know how to laugh at terrible jokes
What is microsimulation? • Microsimulation • is a technique used to create simulated data by combining, or merging various datasets to `populate' and therefore create a `new' synthetic population that is as close as possible to the `real’ population • Spatial Microsimulation • Same as above but with an inbuilt geography • Instead of creating one ‘national’ model we create a series of smaller ‘local’ models = complex
Microsimulation ‘flavours’? • Static Microsimulation - create a microdata set and then policy analysis follows – e.g. Tax and benefit modelling – IFS (UK Budget) • Static Spatial Microsimulation - Same as above but with an inbuilt geography (model presented here) • Dynamic microsimulation – effects of policy over time (e.g. CORSIM – Caldwell 1997) • Dynamic Spatial microsimulation – effects of policy over time and space (e.g. SimBritain – Ballas 2005)
Where is microsimulation used? • for Tax and Benefit modelling in • Australia (STINMOD) • Canada (SPSD/M) • USA (TRIM) • UK (POLIMOD) • EU (EUROMOD) • Norwary (MOSART) • Germany (SFB3) • Netherlands (NEDYMAS) • Belgium (STATION) • Spain (GLADHISPANIA)
Where is spatial microsimulation used? • A few select examples • Sweden (SVERIGE) – dynamic spatial model • UK – SimCrime, SimHealth, Smoking (Leeds/Bradford), SIMALBA (Scotland), SimBritian • Ireland – SMILE: Simulation Model for Irish Local Economy • Australia – SPATIALMSM • NZ – limited use ... Testing reliability of smoking prevalence in New Zealand .. Watch this space?
A Case Study:How to microsimulate? • To build the model (SIMALBA) data from the Scottish Health Survey (SHS) and the UK Census of Population were merged to create the `new’ microdata at various spatial scales • By ... Reweighting existing data using deterministic reweighting techniques (example to follow) • General formula : NWi = Wi * CENij / SHSij - see Ballas 2005; Campbell (2011) – E-thesis; Campbell (forthcoming)
Smaller example: How to microsimulate? Census Scottish Health Survey
Why microsimulate? • Data doesn’t exist elsewhere • e.g. In the UK - Income, Smoking rates, Alcohol, Obesity... At the small area and individual level simultaneously • To explore `what-if’ policy options • Examine distributional effects of policy (socio-economic and demographics) • Examine spatial effects of policy (by area – aggregate to appropriate scale) • Can model policy before implementation to study the effects
Wealth variations using Spatial Microsimulation:An example from Scotland (a similar sized country to NZ?)
Focus on Edinburgh Output Areas • Large area of Holyrood Park stands out as close to the centre
Map reading Note maps are QUNITILE maps • Q1 = bottom 20% of distribution for Lothian Health Board • Q5 = highest 20% of distribution for variable “NEW” simulated data • previously only available by Health Board (n=15) • Microsimulated down to Output Areas (think meshblocks in NZ) - n=42,604 in Scotland • The minimum OA size is 20 resident households and 50 resident people, target size was 50 households.
Map reading (New) simulated ‘economic’ variables at output area geography – note: individual data also exists • Income (not so exciting in NZ? Or is it?) • Housing and Child Benefits
High Earners: £150,000 or more (50% tax rate – ‘losers’) High earners appear more concentrated in areas in the west of Edinburgh (Q5), absent from low income areas (Q1) next slide
Low Earners: up to £10,400 (possible 0% tax rate) • Low earners appear more concentrated in the areas around north of Edinburgh and to the western edges (Q5)
Policy Scenario: Low Earners: £10,400 (possible 0% tax rate – ‘winners’) • The spatial distribution of those who would gain from an increase in tax free threshold (relevant to NZ?) • Can also estimate the income gain in each area and nationally
Health variations using Spatial Microsimulation:An example from Scotland (a similar sized country to NZ?)
Map reading Four (new) simulated health variables at output area geography – note: individual data also exists • Mental well-being: GHQ score • Obesity: BMI • Smoking • Alcohol consumption
Mental Health (GHQ12) • GHQ 0 = “happy” • GHQ 1-3 • GHQ 4 or more = “unhappy”
Mental Health (GHQ12) • `Happy’ (GHQ 0) and Q5 people in areas clustered around `old town’ and to the south.
Mental Health (GHQ12) • `Unhappy’ (GHQ 4 or more) people in areas around North (e.g. Leith) – mentally distressed
Obesity (BMI) • 4 categories • Underweght • Normal • Overweight • Obese – Focus on this
Obesity (BMI) • Highest proportions of obese in areas clustered around North of Edinburgh (e.g. Granton, Muirhouse) and around Holyrood Park
Smoking • Non-smokers • Ex smokers • Less than 20 a day • More than 20 a day • Non-Smokers in areas clustered around `old town’ and to the south and west.
Smoking • Smokers in areas around Leith and edges of Edinburgh City
Alcohol consumption • Under (left) and Over (right) daily alcohol limits • Female (top) and Male (bottom) • 21 (14) units for men (women) per week • Female pattern hard to determine – few clusters
Alcohol consumption • Female pattern hard to determine – few clusters • Men over limits in areas clustered to the south of the City.
Policy Scenario: Individual “stories” By combining survey data with census data • Glasgow, Single female, Housing association (Ten = HA) property, • aged 50, Income approx £6,000 (Cat 6, Type = Low), • Has an illness (Ill = 1) • Semi-routine job (nssec8 = 6), low level of qualifications (Qual = 1) • Deprived area (Dep =7) • Housing benefit (HB = Y), No child benefit (CB = N) • + all the other Census and survey variables (“value added”)
Area Based Policy Scenario: Lothian and Greater Glasgow Health Boards • Creating customised queries: Heavy smokers AND heavy drinkers AND mentally distressed AND obese • top 10% of areas with high risk (red)
Area Based Policy Scenario: Lothian Health Boards • Top 10% of areas with low risk (blue) • top 10% of areas with high risk (red) • If the last slide was too much?
Policy Scenario: Areas of High Suicide Risk? • Men under 25 years old, with a GHQ score of 4 or more (`unhappy’) a potential suicide risk • Microsimulation allows a range of scenarios to be modeled
Future Research? • Making more applied use of microdata created –any suggestions from statistics NZ? • Dynamic Spatial Microsimulation modeling -predicting changes into the future • Cross national comparisons – see Campbell (forthcoming)- comparing Japan and UK • Different contexts for Spatial Microsimulation (NZ – SimAotearoa)
Research Ideas • Suggestions from Statistics NZ? • Particularly looking for feedback from you all on… areas of application and Policy relevance? • Economic (e.g. tax policy) or Health (e.g. smoking, alcohol, obesity, mental health, suicide) or ….. ? • Opportunities for collaboration? Talk to me • ‘adding value’ to existing data – any thoughts?
Discussion and Questions? Feel free to contact me with questions or suggestions Malcolm.Campbell@Canterbury.ac.nz
Geohealth laboratory • Joint venture between: • Department of Geography, UC • Health and Disability Intelligence, Ministry of Health • Undertake policy relevant health research which is relevant to Ministry of Health • Two key functions: • Research • Lab on 3rd floor Geog • Employs staff • House and supports students • Studentships • See website http://www.geohealth.canterbury.ac.nz