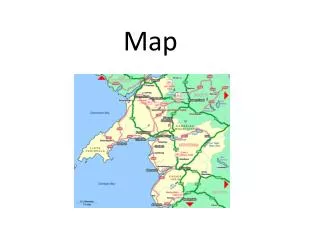
Australian map
Two Worlds of Ageing: Spatial Microsimulation Estimates of Small Area Advantage and Disadvantage Among Older Australians. JUSTINE MCNAMARA, CATHY GONG, RIYANA MIRANTI , YOGI VIDYATTAMA, ROBERT TANTON, ANN HARDING AND HAL KENDIG.

Australian map
E N D
Presentation Transcript
Two Worlds of Ageing: Spatial Microsimulation Estimates of Small Area Advantage and Disadvantage Among Older Australians JUSTINE MCNAMARA, CATHY GONG, RIYANA MIRANTI, YOGI VIDYATTAMA, ROBERT TANTON, ANN HARDING AND HAL KENDIG PRESENTED AT THE 2ND GENERAL CONFERENCE OF THE INTERNATIONAL MICROSIMULATION ASSOCIATION, OTTAWA, CANADA, JUNE 8 – 10, 2009
Acknowledgements • This paper was funded by a Discovery Grant from the Australian Research Council (DP664429: Opportunity and Disadvantage: Differences in Wellbeing Among Australia's Adults and Children at a Small Area Level). • The authors would like to thank our fellow Chief Investigators on this grant, Professor Fiona Stanley, Professor Bob Stimson, Dr Sharon Goldfeld, and the Australian Bureau of Statistics for their input to the broader project being undertaken through this grant.
Why we chose this topic ? • Among 23 OECD countries in 2000, Australia ranked the lowest in terms of ratio of equivalised disposable income of people aged 65 + to 18-64 (59.3 per cent) • Very large differences among older Australians in the distribution of income, wealth and home ownership • Research and policy focuses on geographic differences represent a dimension of inequality – small area analysis • Little research on small areas and older people
What we are going to do • Geographic dimensions of deeply economically disadvantaged older people and advantaged • Social exclusion-multiple sources of disadvantage (economic aspects) • Little focusing on social exclusion of older people in Australia • Combine variables measuring (i) income, (ii) welfare dependence or not and (iii) housing costs • Older people often income poor but asset rich (home owners) • Spatial microsimulation, direct data not available explain later
Coverage and definition • Age cut-off, those aged 65 and above • Two groups (the most vs the least disadvantaged) • relative economic advantage (top two quintiles of equivalised national household disposable income, paying no rent or mortgage, and relying mainly on private household income) • deep economic disadvantage (bottom income quintile, paying private rent, and relying mainly on government income benefits) • Unit of analysis – statistical local area (SLA)
Data source • Reweighting process uses three sources of data : • 2006 Census • Survey - SIH 2003-04 and 2005-06
Spatial methodology • Spatial microsimulation-SpatialMSM/09C • Synthetic household weights for every SLA • Benchmark variables • Complex process of spatial microsimulation • Aggregate SLAs in Canberra and Brisbane (MAUP) • Caution re Northern Territory results • Further exclusions – at the end we use 816 small areas
Spatial Methodology : Reweighting Method turning the national household weights in the SIH 03-04 and 05-06 file into … … household weights of small-areas
Validation • To see if our estimates make sense • Small area validation, see next slides • 65 +, bottom gross income quintile, paying rent in the private market • 65 +, top two gross income quintiles, paying neither private rent nor mortgage. • Aggregate data validation, at state/territory level,
Estimates of the distribution of 65+ deeply economically disadvantaged
Estimates of the distribution of 65+ relatively economically advantaged
Estimates of the distribution of the 65+ deep disadvantage and relative economic advantage, Sydney
Discussion and further work • Substantial heterogeneity among older people • Complex patterns geographically • Although private renting affects small proportion now, it may rise in the future (marriage breakdown + lower rates of home ownership) • Further work : • Further refinement of modelling and validation • Analyse characteristics of the areas with the most concentrated economic disadvantage and advantage (unemployment, industry structure, education levels, age distribution, household composition and poverty rates) • Examine the regional effects of policy changes on older people