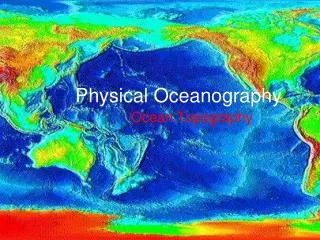
Physical Oceanography
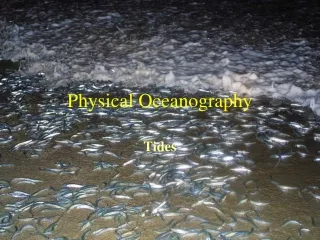
Physical Oceanography. Tides. Tides. Tides are caused by the gravitational force of the moon and sun and the motion of earth. The wavelength of tides can be half the circumference of earth. Tides are forced waves because they are never free of the forces that cause them.

Physical Oceanography
E N D
Presentation Transcript
Physical Oceanography Tides
Tides Tides are caused by the gravitational force of the moon and sun and the motion of earth. The wavelength of tides can be half the circumference of earth. Tides are forced waves because they are never free of the forces that cause them.
Moon Tide Produced by the moon’s gravitation force on water A bulge of water is created by the moon’s gravitational force Centrifugal forces produces a bulge on the opposite side of the Earth & an area of low water between the tidal bulges
Spring Tides • During the period of a new moon, the moon and sun are lined up on the same side of the Earth • Produces the greatest range between high water and low water
Neap Tides • Produced when the moon is at a right angle to the line of centers of the Earth and the sun • The range between high and low water is small
Tide Patterns • Diurnal tide • One high and one low tide per day • Semidiurnal • Twice occurring high and low tide sequences • High and low tides are both at the same level • Semidiurnal mixed tide • Each high tide reaches different heights • Each low tide falls to different levels
Tide Patterns The worldwide distribution of the three tidal patterns.
Tide Patterns Examples of monthly tidal curves Top: Boston, Massachusetts, showing semidiurnal tidal pattern. Upper middle: San Francisco, California, showing mixed tidal pattern with strong diurnal tendencies. Bottom: Pakhoi, China, showing diurnal tidal pattern.
Tide Patterns • Amphidromic Points • A "no-tide" point in an ocean • About a dozen amphidromic points exist in the world ocean. • Sometimes called a node.
Amplitude is indicated by color, and the white lines are cotidal differing by 1 hr. The curved arcs around the amphidromic points show the direction of the tides, each indicating a synchronized 6 hour period. R. Ray, TOPEX/Poseidon: Revealing Hidden Tidal Energyen:GSFC,en:NASA
Tides in a Confined Basin • Tidal ranges vary across the ocean basin • Largest variations occur at the edges • Especially in bays and inlets • Energy is concentrated in a small area • A mini amphidromic system develops • Extreme tides in areas where there are natural oscillation periods of 12 or 24 hours
Tides in Confined Basins . The tidal range is determined by basin configuration
Tides in Confined Basins Tides in a narrow basin. Note that a true amphidromic system does not develop because space for rotation is not available.
The largest tidal range in the world occurs in Nova Scotia's Bay of Fundy. Even thought the maximum spring tidal range at the mouth of the bay is only 2 meters (6.6 feet), amplification of tidal energy causes a maximum tidal range at the northern end of Minas Basin of 17 meters (56 feet), often stranding ships.
Bay of Fundy, High Tide Bay of Fundy, Low Tide
Tides in a Confined Basin • Tidal Bore • A high, often breaking wave generated by a tide crest that advances rapidly up an estuary or river • Occurs in inlets and some rivers exposed to great tidal fluctuations • A true tidal wave
Tide Levels • High water • Greatest height that the tide reaches in a day • Low water • Lowest level that the tide reaches in a day • Mixed tide systems • Higher high tide • Lower high tide • Higher low tide • Lower low tide
Tide Levels • Mean tide • Calculated by taking the average of all the changes in water level over several years • Flood tide • Tide is rising • Ebb tide • Tide is falling
Tidal Currents • Mass flow of water • Ebb current • Flood current • Slack water
Tides and Marine Organisms • Intertidal Zone • Where the land and sea meet, between the high and low tide zones. • Organisms that live here are adapted to huge daily changes in moisture, temperature, turbulence (from the water), and salinity.
Tides and Marine Organisms • Grunions! (Leuresthes tenuis) • Spawn from late February to early September
CLOSED SEASON OBSERVATION ONLY May 10 Tu 10:45 PM - 12:45 AM*11 We 11:20 PM - 1:20 AM* 12 Th 12:00 AM* - 2:00 AM* 13 Fr 12:45 AM* - 2:45 AM* 25 We 10:45 PM - 12:45 AM* 26 Th 11:35 PM - 1:35 AM*27 Fr 12:35 AM* - 2:35 AM*28 Sa 1:50 AM* - 3:50 AM* OPEN SEASON June 8 We 10:25 PM - 12:25 AM*9 Th 11:00 PM - 1:00 AM*10 Fr 11:40 PM - 1:40 AM* 11 Sa 12:20 AM* - 2:20 AM* 23 Th 10:40 PM - 12:40 AM* 24 Fr 11:35 PM - 1:35 AM*25 Sa 12:30 AM* - 2:30 AM* 26 Su 1:35 AM* - 3:35 AM* Expected Grunion Runs for 2005 Where the time relating to the expected run is after midnight, the date of the previous evening is shown. - http://www.dfg.ca.gov/mrd/gruschd.html
Tidal Power • Tidal energy can be exploited in two ways: • By building semi-permeable undersea tidal turbines across estuaries with a high tidal range. • By harnessing offshore tidal streams
Tidal Power • Water flow as basin fills or empties drives turbines • Similar to a wind turbine, but goes in both directions • Requires a daily tidal range of 5-7 meters (~15-21 feet) • Characterized by low capacity factors, usually in the range of 20-35%.
List of World Main Tidal Power Stations Country Power Station Tidal Loss (m) Capacity (MW) Operated Since France Langce 8.5 240 1966 Canada Andeboriece 7.1 19.1 1984 Former Soviet Union Gicelaya 3.9 0.4 1968 China Jiangxia 5.1 3.2 1980 China Baishakou 2.4 0.64 1978 China Xingfuyang 4.5 1.28 1989 China Yuepu 3.6 0.15 1971 China Haishan 4.9 0.15 1975 China Shashan 5.1 0.04 1961 China Liuhe 2.1 0.15 1976 China Guozishan 2.5 0.04 1977
Tidal Power • La Rance, France - world's first tidal power plant • Average tidal range 27 feet • Dam encloses 8.5 sq. miles • Capacity is 320,000 KW
Tidal Power • Low Production but also Low Environmental Impact • No noxious waste • No consumption of resources • Minimum disturbance to scenery