The Impact of the North Atlantic Oscillation on Mediterranean Outflow Water Pathways
This study investigates the Mediterranean Outflow Water (MOW) dynamics and its pathways in the North Atlantic, focusing on the influence of the North Atlantic Oscillation (NAO) from 1960 to 2004. Through observations and simulations using the HYCOM ocean model, we assess MOW's variability related to atmospheric conditions. The findings reveal significant correlations between NAO phases and salinity anomalies in the Rockall Trough, suggesting that the contraction and expansion of the subpolar gyre impact MOW pathways. Further research is required to fully understand these mechanisms.

The Impact of the North Atlantic Oscillation on Mediterranean Outflow Water Pathways
E N D
Presentation Transcript
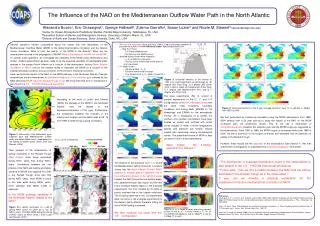
E P R Q1,1,S1 Q2,2,S2 On σ1= 32.10; at MOW core Increasing anomaly NAO- 1960-1969 NAO+ 1985-1994 Strong westerlies: NAO+ Weak westerlies: NAO- The Influence of the NAO on the Mediterranean Outflow Water Path in the North Atlantic Alexandra Bozec1, Eric Chassignet1, George Halliwell2, Zulema Garraffo2, Susan Lozier3 and Nicole M. Stewart3 (abozec@coaps.fsu.edu) 1Center for Ocean-Atmospheric Predictions Studies, Florida State University, Tallahassee, FL, USA 2Rosenstiel School of Marine and Atmospheric Science, University of Miami, Miami, FL, USA 3Division of Earth and Ocean Sciences, Duke University, Duke, NC, USA Several questions remain unanswered about the actual role and importance of the Mediterranean Overflow Water (MOW) in the global thermohaline circulation and the Atlantic Ocean circulation. What is (are) the path(s) of the MOW in the Atlantic? What are the mechanisms involved in the propagation of MOW? What is the impact of the NAO on the MOW? To answer these questions, we investigate the variability of the MOW using observations and model. A basic assessment has been made of (a) the seasonal variability of intermediate water masses in the eastern North Atlantic as a function of the atmospheric forcing (North Atlantic Oscillation or NAO), and (b) the models’ ability to represent the MOW as a function of the sidewall boundary condition and as a function of the choice in horizontal resolution. Here, we study the impact of the NAO on the MOW pathway in the Northeast Atlantic. Previous observations show a mechanism of contraction/expansion of the subpolar gyre induced by the NAO letting the MOW reach the Rockall Troughor not. We show here that such a mechanism is also found in a 1/3° HYCOM interannual experiment. • The Price and Yang model (Price and Yang, 1998) is used as a boundary condition to prescribe the outflow in the HYCOM ocean model. Specified parameters are : • Med. Surf. Fluxes • E-P-R over Mediterranean • Net Heat flux over Mediterranean • Specified Atlantic Ocean Water Properties • 1, S1 of Gibraltar inflow water • Density, salinity of entrained interior water at shelf-slope break • P-Y Model Output • Gibraltar outflow , S2, Q2 • Entrained interior water transport • Final product water , S3, depth, transport(Q3) Q3,3,S3 Figure 3: horizontal sections of the salinity at 1000 m for each experiment. a) climatology, b) .32 degree with Price-Yang ,c) 2 degree with buffer zone in Gulf of Cadiz, d) 2 degree with Price-Yang, f) 1 degree with Mediterranean Sea, and g) 1 degree with Price-Yang. The base experiments (Fig. 3) consist of several experiments of the 2º, 1º, and 1/3º configurations of the HYCOM ocean model with the same initial conditions, boundary conditions, and forcing fields (GDEM3 for T/S climatology and ERA40 for the atmospheric forcing). As in Chassignet et al. (2003), the northern and southern boundaries have been treated as closed and outfitted with buffer zones (roughly 3º wide) in which temperature, salinity and pressure are linearly relaxed toward their seasonally varying climatological values. The prescribed source of MOW is kept constant in time in these experiments. According to the work of Lozier and Stewart (2006), the pathway of the MOW in the Northeast Atlantic may be related to the expansion/contraction of this gyre. Furthermore, the comparison between the evolution of the salinity front location and the NAO index at 55°N from 1960 to 2000 shows a good correlation. Figure 5: Horizontal sections of the 5 year average salinity in layer 14 (2=36.48) in .32deg from 1950 to 2004. We then performed an interannual simulation using the NCEP atmospheric from 1948-2004 starting from a 20 year spin-up to study the impact of the NAO on the MOW northward path. As preliminary results, (Fig. 5) we see a mechanism of contraction/expansion between the subpolar gyre and the MOW tongue as suggested by the observations. From 1950 to 1980, the MOW tongue is contracted while from 1980 to 2004, we see a extension of the tongue northward and westward with an advection of salinity in the Rockall Trough. However, these results are the opposites of the observations (See Section 1). We then need further investigations to understand this contraction/expansion mechanism. Figure 1: Schematic of the subtropical gyre, subpolar gyre and Mediterranean outflow water circulation (Black lines) superposed on the salinity at 1000m (color) (from Lozier and Stewart, 2006). What makes the 0.32deg experiment so different ? Their analysis of the observations of salinity anomalies in the Rockall Trough (Red Circles)show larger anomalies during NAO- years than during NAO+ years. Correlations between the two phases of the NAO and salinity anomalies (positive for MOW and negative for LSW) in the Rockall Trough show also that during NAO- years, more MOW is found in this area while during NAO+ years, more Labrador Sea Water (LSW) is observed. • The mechanism of expansion/contraction found in the observations is also present in the 1/3° HYCOM interannual simulations. • Future work : Can we find a relation between the NAO and the salinity anomalies in the Rockall Trough as in the observation ? • If yes, can we develop a physical explanation for the expansion/contraction mechanism as a function of NAO? The analysis of the isopycnal (layer 14), where the Mediterranean salinity maximum is located, shows that the North Atlantic Current (NAC) appears to actually play an important role in the northward extension of the salinity tongue. Indeed, the NAC bound the two distinct areas: the Labrador/Irminger Sea region and the rest of the northeast Atlantic region. In the 2-degree experiments, the front created by the NAC is poorly resolved due to the coarse resolution. The shoaling observed in the .32 experiments does not occur in the 2-degree experiments in the Eastern North Atlantic therefore letting too much MOW flowing northward. ? Is the MOW pathway variability in the Northeast Atlantic related to the NAO? ? References: Chassignet, E.P., L.T. Smith, G.R. Halliwell, and R. Bleck, 2003: North Atlantic simulation with the HYbrid Coordinate Ocean Model (HYCOM): Impact of the vertical coordinate choice, reference density, and thermobaricity. J. Phys. Oceanogr., 33, 2504-2526. Price, J.F. and J. Yang, 1998: Marginal sea overflows for climate simulations. In: Ocean Modeling and Parameterizations. E. P. Chassignet and J. Verron, Eds., Kluwer Acad. Pub., 155-170. Lozier, M. S. and N. M. Stewart (2006), On the Temporally-Varying Penetration of Mediterranean Overflow Waters Into the Subpolar Gyre, EOS Trans. AGU, 87(36), Ocean Sci. Meet. Suppl., Abstract OS44C-06. Figure 2:a) salinity anomalies on 1=32.10 during NAO- years, b) same as a) but for NAO+ years. Possible MOW pathways during c) NAO- years, d) NAO+ years ) (from Lozier and Stewart, 2007). Figure 5: a), c), e) Depth (in color) and salinity (contour) of layer 14 and b), d) , f) salinity section at 17°W for the GDEM3 climatology (a and b), 2deg-PY (c and d), 0.32deg-PY (e and f). We then continue our study with the 1/3° configuration