Project Placenta
Project Placenta. Ethan Jewett & Megan Lewis. Outline . Motivation Biological Background Goal Factors First model (arterial dilation) Expanded model (trophoblast invasion) Corrected arterial model Conclusion. Motivation.

Project Placenta
E N D
Presentation Transcript
Project Placenta Ethan Jewett &Megan Lewis
Outline • Motivation • Biological Background • Goal • Factors • First model (arterial dilation) • Expanded model (trophoblast invasion) • Corrected arterial model • Conclusion
Motivation • Maternal blood flow to a growing foetus affects foetal development • Too little blood flow can cause miscarriages or pre-eclampsia (a condition that causes hypertension in the mother) • Question: Can something be done to alleviate these problems?
Goal • To model the effect of trophoblast movement, apoptosis and invasiveness on maternal arterial dilation in order to determine their effect on foetal development
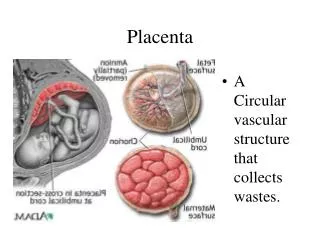
Background: The Placenta During pregnancy, blood flows from maternal spiral arteries into the placenta, allowing nutrient/oxygen and waste exchange between the mother and the foetus
Maternal spiral arteries provide oxygen and nutrients to a growing foetus, as well as removing waste products • During the first trimester, these arteries are widened by trophoblast cells • Trophoblast cells are produced by the foetus, and invade the uterine tissue by random motion and chemotaxis • Once a trophoblast cell reaches an artery, it proceeds to degrade the artery wall • In addition, trophoblasts migrate up the spiral arteries
The trophoblasts replace the smooth muscle inside the artery • The arteries can then deliver the blood required by the developing foetus
Factors • Density of trophoblast cells in the artery • Rate at which trophoblast cells degrade the artery • Chemotaxis and random motion causing trophoblast cells to arrive at an artery • Oxygen and temperature gradients which provide stimulus to direct trophoblast cells to an artery • Amount of muscular material trophoblasts can absorb before maturation
Ro r Artery smooth muscle Artery Trophoblasts Artery wall First model: arterial degredation by trophoblasts
Assumptions for first model • Trophoblasts are at the artery (not worrying about invasion process) • Rate of change of trophoblast density is dependent on the radius of the artery • When an artery reaches maximum radius, no more dilation occurs • Rate of change of the radius is dependent on density of trophoblasts • As the radius reaches its maximum value, the rate of change of trophoblasts decreases to zero
Artery model Initial conditions:R(0)=r T(0)=0 • R(t) – Radius of artery at time t • T(t) – Density of trophoblast cells in artery at time t • Ro – Maximum radius of the artery • s – Density of trophoblasts at which the rate of increase of the radius reaches half its value (assuming Ro-R(t) fixed) • k – Parameter determining rate T(t) increases w.r.t. the radius • b – Parameter determining the mortality rate of trophoblast cells • w – Parameter affecting rate of increase of radius rate w.r.t. time
Phase portrait • Phase portrait of T(t) vs. R(t) • (0,Ro) is a steady state Parameters set to: Ro – 20 (length) s – 10 k – 3 (1/length) b – 4 w – 1 (1/time) r – 5 (length) Initial radius Maximum radius Ro
Changing the value of a: R(t) and T(t) versus time Each line represents a different value of ‘a’ • blue: a= 1 • black: a= 2 • red: a= 3 • green: a=4 • pink: a=5 Shows as ‘a’ increases, the rate at which the radius reaches its maximum also increases and the density of trophoblasts decreases. b – Parameter determining the mortality rate of trophoblast cells w – Parameter affecting rate of increase of radius rate w.r.t. time
Changing the value of q: R(t) and T(t) versus time Each line represents a different value of ‘q’ • blue: q= 1 • black: q= 2 • red: q= 3 • green: q=4 • pink: q=5 Shows as ‘q’ increases, the rate at which the radius grows increases and the density of trophoblasts increases.
Problems • Model isn’t very realistic • Trophoblast density goes to zero as radius goes to zero... It might happen earlier! • With this model, the radius always reaches its maximum • Trophoblast density should be independent of the artery radius • Also would like to model flow of trophoblasts from developing foetus to an artery
How to fix the problem? • Make trophoblast density dependent on time, instead of on artery radius • Develop a model which takes into account more details, specifically the flow of trophoblasts from the foetus to the maternal arteries
Ro r Artery smooth muscle Artery Trophoblasts Artery wall Diffusion model sketch L Trophoblast movement (diffusion) Uterine lining
Diffusion/chemotaxis equation coupled with artery model R(t) :=Radius of artery at time t T(t) :=Density of trophoblasts in artery at time t u(x,t) :=Density of trophoblasts at position x at time t
Diffusion with chemotaxis plot u(x,t) vs. x at different times t values range approx. from 0 to 20
Putting estimate into ODES R(t) and T(t) versus time Each line represents a different value of ‘ψ’ • blue: ψ = 1 • black: ψ = 2 • red: ψ = 3 • green: ψ =4 • pink: ψ =5 Shows as ‘ψ’ increases, the rate at which the radius grows decreases and the rate of change of density of trophoblasts also decreases.
Diffusion/logistic growth equation coupled with artery model R(t) :=Radius of artery at time t T(t) :=Density of trophoblasts in artery at time t u(x,t) :=Density of trophoblasts at position x at time t
Diffusion with logistic growth plot u(x,t) vs. x at different times
Problems/Solutions • Problem: The PDEs are too difficult to solve analytically using Maple (can be solved numerically), but since the ODES require a solution at the boundary, this is a problem • Solution: find a function which resembles the graph of the numerical solution of the PDE at the endpoint, and use it in the original model of the artery
Corrected Artery model (DL) Initial conditions:R(0)=r T(0)=0 Corrected term, no longer dependent on radius
Corrected model:changing the value of alpha R(t) and T(t) versus time Each line represents a different value of ‘α’ • blue: α= 1 • black: α = 2 • red: α = 3 • green: α =4 • pink: α =5 Shows as ‘α’ increases, the rate at which the radius grows increases and the rate of change of density of trophoblasts does not change.
Corrected model:changing the value of omega R(t) and T(t) versus time Each line represents a different value of ‘ω’ • blue: ω = 1 • black: ω = 2 • red: ω = 3 • green: ω =4 • pink: ω =5 Shows as ‘ω’ increases, the rate at which the radius grows increases and the rate of change of density of trophoblasts also increases.
Corrected model:changing the value of psi R(t) and T(t) versus time Each line represents a different value of ‘ψ’ • blue: ψ = 1 • black: ψ = 2 • red: ψ = 3 • green: ψ =4 • pink: ψ =5 Shows as ‘ψ’ increases, the rate at which the radius grows decreases and the rate of change of density of trophoblasts also decreases.
Conclusion • No data, making it very difficult to determine if our models are biologically correct • The models show what was expected, although with data it would be possible to determine how different parameters affect the total blood flow to the foetus
Further work • Model the movement down the artery • Solve the combined PDE and ODE system numerically (coding in numerics) • Find data in order to fit the results and potentially make predictions
Thank You • Gerda de Vries • Jim Muirhead • Gustavo Carrero • And everyone we consulted