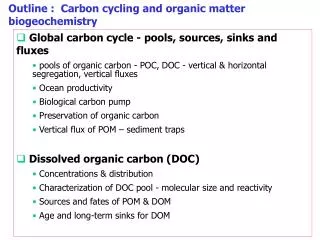
Download

1 / 43
430 likes | 633 Vues
Toward a coordinated global carbon observation and analysis system. and the GEO Task CL-02 “Global Carbon Observations and Analysis” A. Bombelli (CL-02 Task Lead & GEOCARBON Project Manager) CMCC - Euro-Mediterranean Center on Climate Change, Italy. GEO CARBON.

E N D
Toward a coordinated global carbon observation and analysis system and the GEO Task CL-02 “Global Carbon Observations and Analysis” A. Bombelli (CL-02 Task Lead & GEOCARBON Project Manager) CMCC - Euro-Mediterranean Center on Climate Change, Italy GEO CARBON
The Global Carbon Cycle GEO IX PLENARY – European Commission side event. Foz do Iguaçu, Brazil, 21-23 November
State of the art of C-observations State of the art of C-observations Many monitoring networks at global level Many different methods to monitor and analyse C-cycle Many C emissions/absorptions estimates at different temporal/spatial scale Coordination for a global integration of the current systems and data is needed to build a GEOSS for Carbon lack of continuity and sustainability interoperability of the systems and intercomparison of the results are difficult still high uncertainty / still under-represented regions and ecosystems types Impressive scientific information difficult to translate science into policy relevant information BUT…
The Global Carbon Cycle: need for coordination for a global integration GEO IX PLENARY – European Commission side event. Foz do Iguaçu, Brazil, 21-23 November
The European contribution to Global Carbon Observations From COCOS to ICOS & GEOCARBON: the EU leadership for a global GEO carbon observing system Past Present Future ? • FP5/FP6, CARBOEUROPE cluster, CarboAfrica, CarboOcean, others: put in place and/or enhance the EU carbon monitoring system; improved knowledge of the European (and African) C-cycle. • FP7, COCOS: coordinated European and global carbon relevant initiatives; defined the GEO C-Strategy. • FP7, ICOS: set up the infrastructure for a integrated and standardized monitoring of C-cycle at global level, starting from Europe. • FP7, GEOCARBON: global coordination toward the design and development of an Operational Global Integrated Carbon • Observation and Analysis System. Experience Strategy Infrastructure Coordination Operation (beyond research projects) Priority: sustain operational infrastructures for earth observation (particularly in situ)
GEOCARBON European Commission (EC) / Seventh Framework Programme (FP7) Starting date: 01/10/2011 Duration: 36 months Total funds: 8.6 M€ (6.6 M€ from EC) Project Coordinator: Prof. Riccardo Valentini Euro-Mediterranean Center for Climate Change CMCC, Italy European project but global contribution! To develop a coordinated Global Carbon Observation and Analysis System, supporting the Group on Earth Observations (GEO) toward building a Global Earth Observation System of Systems (GEOSS) for carbon (last 3 years of the GEO WP).
Geo Carbon Strategy • New version IGCO report • Coordinated by Carbon Community of Practice • Recommendations for short and long term developments • Living document • Developed by COCOS • to be continued by GEOCARBON A rationale for GEOCARBON
& • GEOCARBON was conceived in response to a call for proposals launched by the European Commission in 2010. The aim was to support a European project specifically contributing to GEO at global level in the area of C-cycle. • The project is shaped around the GEO Work Plan and particularly its task CL-02, ‘Global Carbon Observations and Analysis’, in order to meet the GEO targets for carbon (within the climate target): • better understanding of the global carbon cycle • development and facilitation of a comprehensive (atmosphere, ocean, land) global carbon observation and analysis system in support of monitoring based decision-making and related environmental treaty obligations. • GEOCARBON activities are embedded in the task CL-02 and are coordinated with the GEO Secretariat and GEO global community monitoring C-cycle. • GEOCARBON is different from previous EC “Carbon” projects: not just independent research but a contribution to GEO!
GEO Task CL-02 Global Carbon Observation and Analysis Observe Share Inform GEO: Observe, Share, Inform Task CL-02: Observe, Share, Inform collect, synthetize and analyze carbon cycle observations (pools and fluxes) in all its domains (atmosphere, land, water, and human dimension) by ground and space based approaches carbon related data, database, products, etc. (through GCI, i.e. GEO Portal, GEOSS Data Core) decision makers to timely address environmental policies
GEOCARBON – The partnership 1 Euro-Mediterranean Center for Climate Change (CMCC), Italy 2 University of East Anglia, United Kingdom 3 Swiss Federal Institute of Technology Zürich (ETHZ), Switzerland 4 University of Wageningen, The Netherlands 5 University of Oxford, United Kingdom 6 VU University of Amsterdam, The Netherlands 7 University of Leeds, United Kingdom 8 Max Planck Institute for Biogeochemistry, Germany 9 University of Versailles, LSCE France 10 Netherlands Institute for Space Research (SRON), The Netherlands 11 Second University of Naples, Italy 12 University of Edinburgh, United Kingdom 13 Nansen Environmental and Remote Sensing Center (NERSC), Norway 14 University of Tuscia, Italy 15 University of Bergen, Norway 16 GAMMA Remote Sensing Research and Consulting AG, Switzerland 17 Cameroon Biodiversity Conservation Society, Cameroon 18 FastOpt, Germany 19 University of Bristol, United Kingdom 20 International Institute for Applied Systems Analysis (IIASA), Austria 21 Research Institute of Nuclear Energy (IPEN), Brazil 22 Food and Agriculture Organisation of The United Nations (FAO) 23 Free University of Brussels, Belgium 24 National Center for Scientific Research (CNRS), France 25 University of Hamburg, Germany
GEOCARBON – Working Components Project Management 1- Observation data streams 3- Specifications and Network Design 7- Cost benefit analysis 2- Data assimilation system (CCDAS) 6- CH4 8- Outreach and GEO Interface 5- Global and regional synthesis 4- Tropical hotspots Data exchange Coordination links
GEOCARBON Component 1 - Observations data streams Provide an aggregated set of harmonized global carbon data. WP1: Land stocks & change WP2: Land-atmfluxes WP3: Lateral fluxes WP4: Oceaninv. & fluxes WP6: Atmospheric & other WP5: Anthropogenicfluxes WP7: Integration & synthesis Carbonoffice Component 2 Component 4
Surface Ocean CO2 Atlas V2 • SOCAT: world largest surface CO2 database: >9 million CO2 data (+ sea characteristics, i.e. temperature, salinity, etc.) • Time frame: 1968-2011 • Second version (blue lines) • supported by GEOCARBON: • 60% data more than previous vs (red) • Uniform format • Transparent, fully documented • Open accessible by Spring 2013 • Supported by UNESCO/SCOR’s IOCCP, SOLAS and IMBER CMP1 (example) www.socat.info
Global land stocks and changes CMP1 (example) www.rainfor.org M. Herold, Geocarbon WP1
Global Forest Biomass CMP1 (example) • Derive a global abovegroundforestbiomassdataset • (September 2013) • Strategy: • Combine existingdatasets (weightedaverageapproach) • Regional validation (independent field data and local maps) • Specifications: • Spatial resolution: 1 Km • Variable: Aboveground live biomass of trees with dbh >10 cm • (expansion for 0 – 10 cm may be also performed) • Reference period: circa 2005 – 2010 • (depending on the reference years of the input maps) • Validation: Discrepancy map & Error statistics COORDINATION WITH GFOI ENSURED: GEOCARBON WP1 leader, Martin Herold, member of advisory board for methods and guidance for GFOI
Forest Biomass/Volume maps M. Santoro, 2012 CMP1 (example) GSV - Santoro, 2012
FLUXNET: A Global Network of Observation Sites500+ Sites, 10 Regional Networks, 45 Countries DATASETS CMP1 (example)
GEOCARBON Component 2 - CCDAS Ocean & terrestrialin situ data Land imager (SAR: Biomass) Land use & forest data Ocean model ecosystem model Remote sensing atmospheric data Anthropogenic emissions Atmospheric model CO2 conc. (GOSAT, OCO2,…) Wind & Temp. profile 5 global data assimilation systems (simultaneously integrating models and observations of the land, ocean and atmosphere carbon cycle) + 2 ocean-only process models. Natural & Human GHG emission map
GEOCARBON Component 3 Accuracy requirements and network design Define the detailed requirements for an operational integrated global carbon observing system. Considering: different (ground and space based) networks sampling the ocean, the land and the atmospheric carbon reservoirs. Including: accuracy requirements, network performance, gap analysis, and feasibility.
GEOCARBON Component 4 – C-cycle in the tropics GEOCARBON Case study: Application of the carbon observing system in the Tropics, with a focus on Africa and Amazon (details in the last slides!)
GEOCARBON Component 5 Integrated CO2 budgets and uncertainties Fate of Anthropogenic CO2 Emissions (2010) 9.1±0.5 PgC y-1 5.0±0.2 PgC y-1 50% 2.6±1.0 PgC y-1 26% Calculated as the residual of all other flux components + 0.9±0.7 PgC y-1 24% 2.4±0.5 PgC y-1 Average of 5 models
Carbon Budget 2010 Contributors Thomas A. Boden Carbon Dioxide Information Analysis Center, Oak Ridge National Laboratory, Oak Ridge, Tennessee USA Gordon Bonan National Centre for Atmospheric Research, Boulder, CO, USA Laurent BoppLaboratoire des Sciences du Climat et de l’Environnement, UMR, CEA-CNRS-UVSQ, France Erik Buitenhuis School of Environment Sciences, University of East Anglia, Norwich, UK Ken Caldeira Depart. of Global Ecology, Carnegie Institution of Washington, Stanford, USA Josep G. CanadellGlobal Carbon Project, CSIRO Marine and Atmospheric Research, Canberra, Australia Philippe CiaisLaboratoire des Sciences du Climat et de l’Environnement, UMR CEA-CNRS-UVSQ, France Thomas J. ConwayNOAA Earth System Research Laboratory, Boulder, Colorado, USA Steven Davis Depart. of Global Ecology, Carnegie Institution of Washington, Stanford, USA Scott C. DoneyWoods Hole Oceanographic Institution, Woods Hole, Massachusetts, USA Pierre Friedlingstein Laboratoire des Sciences du Climat et de l’Environnement, FranceQUEST, Department of Earth Sciences, University of Bristol, UKJoe L. Hackler Woods Hole Research Center, Falmouth, Massachusetts, USA Christoph Heinze University of Bergen, Norway Richard A. Houghton Woods Hole Research Center, Falmouth, Massachusetts, USA Corinne Le QuéréTyndall Centre for Climate Change Research, University of East Anglia, UK Andrew Lenton CSIRO Marine and Atmospheric Research, Tasmania, Australia Ivan Lima Woods Hole Oceanographic Institution, Woods Hole, Massachusetts, USA Gregg MarlandResearch Institute for Environment, Energy and Economics, Appalachian State University, Boone, North Carolina, USAGlen P. PetersCenter for International Climate and Environmental Research, Oslo, NorwayMichael R. RaupachGlobal Carbon Project, CSIRO Marine and Atmospheric Research, Canberra, Australia Stephen SitchSchool of Geography, University of Leeds, Leeds, UK Jerry Tijputra University of Bergen, Norway www.globalcarbonproject.org Now also GEOCARBON!
Emission estimates Evaluation Process modeling measurement campaigns Emission inventory Inverse modeling Synthesis Measurements Flux variability Satellites Global budgets Surface networks GEOCARBON Component 6 Global CH4 cycle Integration and synthesis of the global CH4 cycle Wetlands SCIAMACHY, GOSAT, IASI.
GEOCARBON Component 7 Costs-benefits analysis Provide an economic (cost and benefit) assessment of the value (monetary and non monetary) of an enhanced Global Carbon Observation System. Expected value Over-compliance to ensure that target is met Track 1 (led by IIASA & CMCC, partners: LSCE-IPSL) Benefit = Less expensive policy (avoided deforestation) through reduced uncertainty (less overcompliance needed, less underreporting possible) Track 2 (led by IIASA & CMCC, partners: FASTOPT, University of Bristol) Benefit = Less expensive to reach target due to earlier commitment, reduced risk of irreversible damages Track 3 (led by IIASA & CMCC) Coupling of land use and energy-economy models Undetected under-reporting Probability Carbon flux from deforestation
GEOCARBON Component 8 Outreach and Project Coordination • GEO-Carbon-Office (GCO) just launched! • Interface with EC • Liaise with GEO Secretariat and GFOI • Strengthen the effectiveness of the global carbon community participation in GEO • Enhance the communication flow among the different communities • Support the Carbon Community of Practice • Mediate between science and policy • Outreach Component 8 Dissemination and exploitation of the results. Turn the results into policy relevant information. Liaise with relevant partners and decision makers. COORDINATION WITH GFOI UNDER DEVELOPMENT Currently: sustained and coordinated by the GEOCARBON Project, with a global perspective (not Europe only!) Ambition: engage a wider community and become an international coordinating office sustained by an international organization or partnership, after the project’s end (from 2015 onwards).
GHG observations by GOSAT Greenhouse Gases Observing Satellite (GOSAT) Monthly GOSAT XCO2 observations (TANSO-FTS SWIR Level 2 Ver.02.00, 2.5 deg. grid monthly means of XCO2)
GHG observations by GOSAT Greenhouse Gases Observing Satellite (GOSAT) Monthly GOSAT XCH4 observations (TANSO-FTS SWIR Level 2 Ver.02.00, 2.5 deg. grid monthly means of XCH4)
GHG observations by GOSAT Greenhouse Gases Observing Satellite (GOSAT) Data validation activities have been conducted by worldwide research groups • Column concentrations of CO2 and CH4 have been retrieved by several groups (institutes and universities) in the world. • These data are validated with TCCON FTS data and/or airplane data. • Present GOSAT XCO2 data quality is within -0.3% bias and 0.5% variation.
Activity in AIST, JAPAN Flux observation in Japan (TKY) and Thailand (SKR, MKL) in forest site Flux measurement in Tokyo (urban site) Data acquisition with SOS standard in OGC SKR MKL Takayama (TKY) is the oldest monitoring site in Asia since 1993 Location:36.1oN, 137.4oE, 1420m Numerical simulation of local transport of CO2 around Tokyo Comparison with the observation at MRI, Tsukuba TSUKUBA(MRI) ★ A handbook was published with FFPRI, NIAES and NIES (2011) ★ ★ ★ SHIRAKO ICHIHARA 13:00JST, Jan. 7, 2011
CO2 Data assimilation using AIST-MM and NICAM-TM Kanto Plane GOSAT Ground based obs. Specific obs. mode Narita Vertical profiles CONTRAIL NICAM-TM Global Simulation as the boundary condition Central Tokyo Power plants (by Y.Niwa) AIST-MM (by H.Kondo) CO2 concent. (ppmv) Objective : Developing CO2 Data assimilation system for assessing urban CO2 emissions
CO2 transport simulation AIST-MM: horizontal resolution = 2km Global Regional (urban area) Wind direction:NW Electric Power Plant Wind direction:SE (NICAM-TM: from Y. Niwa, AIST-MM: H. Kondo)
GEOCARBON Component 4 – C- cycle in the tropics GEOCARBON & Brazil!
EOS land use Atmospheric concentrations Biomass inventories Ecosystem fluxes River carbon GEOCARBON Component 4 – C- cycle in the tropics A combination of Case study: the observing system in the tropics: Amazon and Africa Reduce the uncertainty of the net carbon balance and trends of tropical South America and Africa in order to improve regional C-budgets. GEO IX PLENARY – European Commission side event. Foz do Iguaçu, Brazil, 21-23 November
RAINFOR monitoring in S. America www.rainfor.orgwww.afritron.orgwww.forestplots.net RAINFOR: more than 200 partners & 30 nations. Global collaborative measurements of >800 plots since 2000. Common protocols, for field monitoring of forests’ biomass, biodiversity and long-term carbon balance + data analysis RAINFOR in South America: > 350 field plots, of which 139 in Brazil 1985 – now! Now coordinated with GEOCARBON! RAINFOR Moore funded plots Intensive plots Collaborators' plots Pre 2008 plots
RAINFOR includes O. Phillips1, Y. Malhi2, J. Lloyd1, T. Baker1, G. Lopez Gonzalez1,L. Arroyo3,4, N. Higuchi5, T. Killeen3,6, W. Laurance7,8, S. Lewis1,9, A. Monteagudo10,11, F. Ramirez, D. Neill4, P. Núñez Vargas10, N. Silva12,13, J. Terborgh14, R. Vásquez Martínez11, S. Almeida16, R. Brienen1, J. Chave18, J. A. Comiskey19, C. Czimczik, A. Di Fiore20, T. Erwin19, T. Feldpausch1, E. Jimenez, S. Patiño1, 22, J. Peacock1, N. Pitman15, A. Prieto, C.A. Quesada23,1, M. Saldias3, M. Silveira, A. Torres Lezama24, B. Vinceti25, E. Alvarez26, M.C. Peñuela, A. Rudas-Ll27, L. Anderson2, L. Aragao2, S. Brown17, N.D. Cardozo, K.-J. Chao1, M. Garcia-Hernandez1, J. Silva, E. Honorio, I. Huamantupa, A. Peña Cruz, H. Ramirez, R. Salomão, N. Salinas, M. Schwarz, A. Sota, H. ter Steege, J. Stropp, G. van der Heijden1, H. Keeling1, C. Kuebler6, S. Laurance7,8, H. Nascimento7,8, J. Olivier18, W. Palacios21 1. University of Leeds, UK. 2. University of Oxford, U.K. 3. Museo Noel Kempff Mercado, Santa Cruz, Bolivia. 4. Missouri Botanical Garden, St. Louis MO, USA. 5. Instituto National de Pesquisas Amazônicas, Manaus, Brazil. 6. Center for Applied Biodiversity Science, Conservation International, Washington DC, USA. 7. Smithsonian Tropical Research Institute, Panama. 8. Biological Dynamics of Forest Fragments Program, Manaus, Brazil. 9. School of Geosciences, University of Edinburgh, UK. 10. Herbario Vargas, Universidad Nacional San Antonio Abad del Cusco, Peru. 11. Proyecto Flora del Perú, Jardin Botanico de Missouri, Oxapampa, Perú. 12. CIFOR, Tapajos, Brazil. 13. EMBRAPA Amazonia Oriental, Belém, Brazil. 14. Center for Tropical Conservation, Duke University, Durham NC, USA. 15. New York Botanical Garden, Bronx NY, USA. 16. Museu Paraense Emilio Goeldi, Belem, Brazil. 17. Winrock International, Arlington VA, USA. 18. Laboratoire Evolution et Diversité Biologique, CNRS/UPS Toulouse, France. 19. Smithsonian Institution, Washington DC, USA. 20. Department of Anthropology, New York University NY, USA. 21. Fundacion Jatun Sacha, Quito, Ecuador. 22. Alexander von Humboldt Biological Research Institute, Bogotá, Colombia. 23. Departamento de Ecología, Universidade de Brasilia, Brazil. 24. INDEFOR, Universidad de Los Andes, Mérida, Venezuela. 25. International Plant Genetic Resources Institute, Rome, Italy. 26. Equipo de Gestión Ambiental, Interconexión Eléctrica S.A. ISA., Medellín, Colombia 27. Instituto de Ciencias Naturales, Universidad Nacional de Colombia, Bogotá, Colombia.
Each year pre-2005 Amazon gained 0.45 [0.3,0.6] Pg C Phillips et al. Drought Sensitivity of the Amazon Rainforest. 2009.
During 2005 Amazon lost 0.9 [0.2,1.6] Pg C (including committed losses) Phillips et al. Drought Sensitivity of the Amazon Rainforest. 2009.
CO2 vertical profiles over Amazon supported by GEOCARBON 2 sites currently funded by GEOCARBON: - Tabatinga, Amazonas state - Alta Floresta, Mato Grosso state
Current results for Amazonia Amazonian intact forests were/are a carbon sink This sink is vulnerable to climate change! Fires, high temperature and drought can neutralize it! GEO IX PLENARY – European Commission side event. Foz do Iguaçu, Brazil, 21-23 November
GEOCARBON Conference + meetings in 11-15 March 2013 GEOCARBON related events, 11-15 March 2013 in Geneva 11 March 2013: GEOCARBON internal meeting Internal update on the project progress to organize the project reporting to EC 12-13 March 2013: Conference "Towards a global Carbon Observing and Analysis System: Specifications, Uncertainties and Tropical Hot Spots" Scientific presentations about the “carbon” work in the frame of GEO to share findings and promote collaborations Participants: GEO “carbon” community, potential users and stakeholders, EC. 14-15 March 2013: GEO CL-02 Task meeting Meeting of the GEO CL-02 task on Global Carbon Observations and Analysis System. To revamp the engagement and coordination of the GEO carbon community, and link with GFOI and FCT. Suggestions and active involvement and participation are welcomed!
Toward a coordinated global carbon observation and analysis system THANKS! GEO CARBON antonio.bombelli@cmcc.it www.cmcc.it