Spreadsheet Essentials for Financial Analysis | Module Introduction & Learning Outcomes
470 likes | 558 Vues
Get familiar with spreadsheet basics, learn to solve business problems, and implement solutions using Excel. Explore module contents, assessments, and self-directed projects. Engage in tutor-led sessions, workshops, and tutorials to enhance your financial forecasting skills.

Spreadsheet Essentials for Financial Analysis | Module Introduction & Learning Outcomes
E N D
Presentation Transcript
Spreadsheets in Finance and Forecasting Lecture 1 Introduction Spreadsheet Basics An Example Resources
Introduction to the Module The purposes of this introduction are: • To give you a clearer understanding of the position of this module in your programme • To introduce you to the learning outcomes and learning styles of the of the module • To give an overview of the module handbook
The BIM Programme • This is the first module of your programme which identifies you as a BIM student. • This module draws together the two strands of your programme: IT and Business. • In order to succeed at this module, you will need to draw on what you have learnt in previous modules (both IT and Business)
The Module Handbook This contains • Information about the BIM programme • A full description of the contents of this module • A week-by-week summary • Details of Assessment • Other information, including texts and advice.
Other Materials There will also be: • Tasks and Activities • Web-based tutorial materials • Resource Files • Downloads • Other stuff, e.g. assessment criteria • In- Class Tests
The Learning Outcomes By the end of the module you will be expected to: • Be able to identify and analyse business problems using appropriate techniques and methodologies • Be able to formulate models to solve a range of business problems, and evaluate these models. • Identify data sources and flows, and how these affect a system. • Design systems that use external and internal data sources • Use spreadsheet and related tools to implement solutions to business problems • Recognise the organisational issues associated with the implementation of IT solutions.
The Challenges • As befits a level II, semester 4 module, much of the learning here will be independent of tutor input. • An important part of this will be the completion of a portfolio of tasks and a project worth 60%
The Module Content The module is split into: • Spreadsheet Topics • Blocks of work on Basics, Charts, Forms, Macros etc. • The Project • A self-directed project in which you will apply spreadsheet solutions to a business problem.
Learning on this Module This module consists of • Tutor-led input sessions • Workshop sessions using web-based materials and directed tasks • Individual Tutorials • Open and Distance-Learning materials
Module timetable • There are two sessions per week. • There will normally be one tutor-led and one workshop session in the week. • In the first part of the module we will concentrate on spreadsheets • In later weeks will concentrate more heavily on the project
Assessment • Two in class tests: (2 x 20%= 40%) • Portfolios of tasks & Activities (2 x 15%= 30%) • Project Work • Tutorial 5% • Presentation & supporting evidence 25% Total 30%
Learning about Spreadsheets Each topic block will normally comprise: • A tutor-led introduction • Web-based tutorial materials • A directed activity • An assessed task
Carrying out the project You will • Find a small business context • Identify the data flows within the organisation • Select some of the data to model using spreadsheets • Offer spreadsheet solutions to enhance their working
When will we find out more? • The first session discussing the project will be the session in the later part of next week. • In this session we will: • Discuss the project in detail • Look at the timetable for the project • Consider possible contexts
What you need to do now • Read through the module handbook carefully • Think about a business context you can use for the project • Find any materials you have previously studied related to spreadsheets or small business applications.
Resources • The resources for this module are held on the web at the website beam.to/spreadsheets • You should access this site on a regular basis (i.e. several times per week). Access this website now. • This website allows you to retain current contact with the module even if you miss a lecture.
The Website General Notes & Information Link to each week’s materials Work for other weeks
The Website Guidance for what to do in each week. Link to this week’s materials Scroll down for the resources
The Resource Packs • Each week a new section of the the homepage will be enabled in the left hand panel. • These will link to a page of resources and materials that you need for that week’s study.
Links for Week 1 Resources for Week 1 contains: • Bulletin 1, an html document explaining what to do in each week. • PowerPoint Presentation 1 (this one!), which is the main lecture for the week • Balance Sheet , a spreadsheet file. • Formative Activity 1, a Word Document, which takes you through building a spreadsheet for Cornershop inc. sales. • Resources and Links for Week 1, an html document containing instructions and advice about Excel tutorials, giving hyperlinks to Web-based resources
Tasks and Activities • The Tasks and Activities have been collected together in two separate booklets. • Booklet 1 covers weeks 1-6 • Booklet 2 covers weeks 7-12
Tasks and Activities 1 There are 4 formative activities: • Week 1: Cornershop • Week 2: Charts, Tables & Reports • Week 3: Savings, Loans & Mortgages • Week 4: SCHOOL Results These are worth 10% in total. There is one summative Task: • Week 5: Shares Portfolio This is worth 5% You may collaborate on these activities You may not collaborate on this task
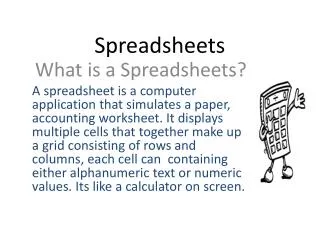
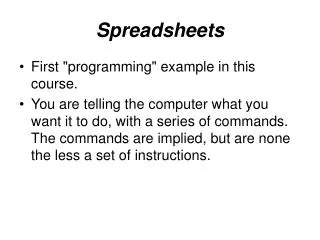
Spreadsheet Basics The purposes of this section are: • To remind (or introduce) you to the Excel spreadsheet format • To ensure that you can navigate the spreadsheet, open, save, enter and edit data • To provide you with a basic overview of spreadsheet functions.
Spreadsheet Example Click on to the Spreadsheet called BalanceSheet Use this to try out the ideas in the next few examples.
The Spreadsheet Window The Worksheet Row 10 Cell F10 Column C
Navigating the window (1) • With the Mouse • Position the cursor over the cell & click! • With the Scroll Bars • Use the mouse to click and drag
Arrow Keys Ctrl Arrow Ctrl Home Ctrl End Page Up/Down Alt Page Up/Down Ctrl Page Up/Down up/down/left/right Next nonblank cell Cell A1 Last cell used Up/down a screen Left/right a screen Previous/Next Sheet Navigating the Window (2)
Navigating the Window (3) Using the Go To Box: Select Edit, Go to Or press F5 Type in the cell address e.g. C10
Entering Data and Formulae Formula Bar Cancel Enter Edit Formula = As you type, new data appears in the active cell You can enter up to 32 K characters in a single cell
Numbers and Formulas Each cell can be • Text • Names, details etc. • Dates, Times • Numerical • Integers (whole numbers) • Decimals (e.g. 3.142) • Fractions (e.g. ¾) • Scientific Notation (e.g. 1.23 E+08) • A Spreadsheet Formula • For example “= A1 + A2”
Examining Cell Contents • Examine cells on the spreadsheet and see whether they contain : • Text, • Numbers • Formulae Which cells contain formulae? What do these mean?
Opening and Saving To Open: Choose File, Open Select File with green XL icon Double click To Save: Choose File, Save As Type in the name of the file & return
Printing (1) • Choose File, Print • The dialog box appears • Use the box to select what you need • Particular sheets • A selection • You can examine what will be printed in a preview
Getting Help The ‘help’ facility in Excel is very useful. If you have the “help character” on the screen, double click and type in what you want to find out about You can do the same by selecting “help” from the toolbar, or pressing F1.
The Next Steps • We will now work through Formative Activity 1, and this will take us into the next session. • After you have completed this activity, you should access the website, read Bulletin 1, and carry on from there.
Spreadsheet Example • We will create an example sheet to analyse sales figures for a number of locations in the North West • The initial spreadsheet structure will be created, then you will be asked to complete it on your own. • This is the first Activity in Portfolio 1
Formative Activity 1 The purposes of this activity are: • To further demonstrate the ideas underlying spreadsheet construction • To develop further your toolkit, in particular use of • formulas • auto fill • formatting • cutting and pasting
Cornershop, Inc. own small corner grocery and newsagents in suburb locations The information is supplied on the sales of items in each shop over a one week period. The locations are: Aughton, Bury, Childwall, In each shop they supply: Newspapers Stationery Groceries Confectionery; Cornershop, Inc.
The Challenge in Brief • Create a spreadsheet page for each location which will provide totals for • each day(by category) • each category (by day) • the sales for each week • Provide a summary spreadsheet which will compare the figures from each branch over the week Formative Activity 1 now continues this challenge..
Links for Week 1 Resources for Week 1 contains: • Bulletin 1, an html document explaining what to do in each week. • PowerPoint Presentation 1 (this one!), which is the main lecture for the week • Balance Sheet , a spreadsheet file. • Formative Activity 1, a Word Document, which takes you through building a spreadsheet for Cornershop inc. sales. • Resources and Links for Week 1, an html document containing instructions and advice about Excel tutorials, giving hyperlinks to Web-based resources