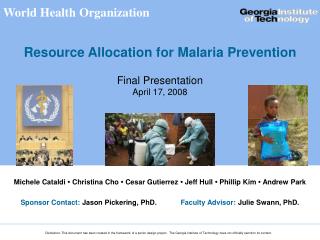
Optimizing Resource Allocation for Malaria Prevention: A Systems Approach
This presentation addresses the critical issue of malaria, which has millions of cases and deaths annually. It presents a strategic approach to optimize resource allocation for malaria prevention methods, such as Indoor Residual Spraying (IRS) and Long-Lasting Insecticide Treated Nets (LLIN), particularly in Swaziland. By developing a systems-based model, we aim to streamline decision-making on distribution center placements, resource deployment, and target zones, ensuring effective and efficient use of limited resources for the highest impact on malaria reduction.

Optimizing Resource Allocation for Malaria Prevention: A Systems Approach
E N D
Presentation Transcript
World Health Organization Resource Allocation for Malaria Prevention Final PresentationApril 17, 2008 Michele Cataldi • Christina Cho • Cesar Gutierrez • Jeff Hull • Phillip Kim • Andrew Park Sponsor Contact: Jason Pickering, PhD. Faculty Advisor: Julie Swann, PhD. Disclaimer: This document has been created in the framework of a senior design project. The Georgia Institute of Technology does not officially sanction its content.
Agenda • Client Background • Problem Description • Solution Strategy • Model • Deliverables • Value
Client Background • World Health Organization • Responsible for providing leadership to all UN member nations on global health matters • Public Health Mapping Group • Data analysis, process and visualization via Geographic Information Systems (GIS)
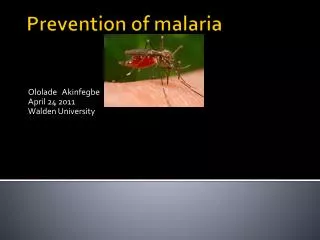
Problem Description • Malaria • 300-500 million cases per year and over 1 million deaths • Prevention methods • Indoor Residual Spraying (IRS) • Long-Lasting Insecticide Treated Bed Nets (LLIN) • No existing procedure for optimal allocation of limited prevention resources • Arbitrary distribution • Detrimental effects of excessive spraying
Solution: Strategy • Create a systems-based approach to minimize the incidence of malaria with limited resources. • Swaziland as pilot country • Historical data availability • Wide range of conditions http://www.mara.org.za/ http://en.wikipedia.org/wiki/Swaziland
Data Sources • Mapping Malaria Risk in Africa (MARA) • Percentage risk estimation by region • 5x5 km spatial resolution • Start and end months of high malaria transmission http://www.mara.org.za/ http://www.mara.org.za/
Data Sources • HealthMapper Road Infrastructure Facility Infrastructure
Data Sources • Costs and other intervention data • World Health Organization Malaria Costing Tool • UN Millennium Project
Model Objective • An optimization model will allow for a systems-based approach to resource allocation and deployment for malaria prevention. • Decisions include: • Where to locate Distribution Centers (DCs) • How many DCs to open • When DCs should be open • What regions DCs should serve • When to cover each zone • Number of people to protect in each zone • Labor, trucks, equipment, insecticide/nets to base at DCs • Labor, trucks, equipment to allocate to each zone
Model Overview DC Placement Heuristic Zone Assignment Heuristic Resource Deployment Model Decision Tool
DC Placement Heuristic • Potential locations for DCs • Factors considered: • Population • Malaria risk • Infrastructure • Scalable for other countries • Distance constraints adjusted by estimated area Max. distance from center point: Min. distance between DCs: *where d represents ½ the (estimated) height of the country, and n the number of DCs
DC Placement Heuristic Swaziland: 5 DC Placement MalariaRisk Population
Zone Assignment Heuristic • Customer zones are serviced by a single DC • Straight-line distance: DC to customer zone • Road factor of zone considered (paved, unpaved) Zone Assignment with 3 DCs Zone Assignment with 5 DCs
IRS Resource Deployment Model • Objective: Maximize the number of people protected by a prevention method who are at risk of malaria. • Output: scheduled deployment plan • What zones to target for spraying • When to deploy in each zone • How many people in each zone to protect • Resources to base at DCs
Assumptions • MARA • Risk and transmission season accurately represented by MARA • 5x5 km MARA grids aggregated into ~15x15 km zones • Intervention • IRS with DDT • Materials ordered once per year, prior to deployment • 1 spray cycle per year • Straight line distances adjusted for road conditions of zone Distribution Center Zone(s) Zone(s) Zone(s) …… Zone(s) …… time 1 time 2 time 3 time T
IRS Constraints • Deployment restricted by:
LLIN Resource Deployment Model Advertisement of net pickup place and time to zones DCs open for net pickup and instruction on proper use • Adapted output • When to open the DCs • What zones to target • Number of public health workers and supervisors at DCs • Extent of advertising in targeted zones time(0) ... time (DC open) time(DC open) ... time (DC close) Zone(s) Zone(s) Zone(s) Zone(s) DC DC Zone(s) Zone(s) Zone(s) Zone(s)
Recommendation • Labor based at each DC
Recommendation • Deployment schedule *For full deployment schedule, see animation
Model Interface • Decision-making application using Excel and VBA • Linked to Xpress-MP
Deliverables • Optimization model • Description, specification of model • Decision-making tool • Test interface in Excel • Output • Sensitivity analysis • Objective response to changes in parameters • Documentation • All assumptions, processes, and methodology
Value • Use of heuristics to estimate expected current deployment behavior • 3 heuristic variations, prioritize zones to cover by: • Greatest risk first • Greatest population first • Greatest combined risk and population first • All variations assume: • 1 DC in Mbabane (capital) • Equivalent objective, budget, and resource constraints
Value *The American Society of Tropical Medicine and Hygiene, http://www.ajtmh.org/cgi/reprint/77/6_Suppl/138
Value Africa alone loses an average of 12 billion US dollars of income per year, because of malaria. WHO/Gates Foundation Project Malaria Atlas Project http://www.map.ox.ac.uk
Summary • Problem Description • Solution Strategy • Model • Recommendations • Value