Download
1 / 1
10 likes | 115 Vues
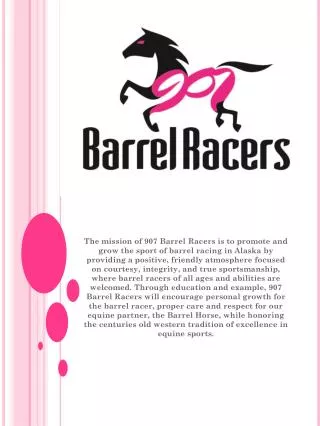
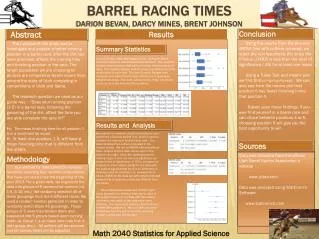
Investigating how running position affects finishing times in barrel racing. The study used ANOVA and Tukey Test to analyze data from competitive barrel racers in Utah and Idaho. Results show position 5 yields faster times. Useful insight for competitive barrel racers.

E N D
Abstract Conclusion Results Using the results from the one-way ANOVA Test with outliers removed, we reject the null hypothesis (H0) since the P-Value (.0483) is less than the level of significance (.05) for at least one mean Using a Tukey Test and means plot we find that µ1=µ2=µ3=µ4≠µ5. We can also see from the means plot that position 5 has faster finishing times that position 4. Based upon these findings, if you ever find yourself in a barrel race and can chose between positions 4 or 5, choosing position 5 will give you the best opportunity to win The purpose of this study was to investigate and analyze whether running position in a barrel race, after the dirt has been groomed, affects the running time and finishing position in the race. The target population we are choosing to analyze are competitive barrel racers from around the state of Utah competing in competitions in Utah and Idaho. The research question we used as our guide was : “Does your running position (1-5) in a barrel race, following the grooming of the dirt, affect the time you are able complete the race in?” H0: The mean finishing time for all position 1-5 in a barrel will be equal. Hi: At least one position, 1-5, will have a mean finishing time that is different from the others Summary Statistics Upon Collection, data was organized into statcruch where summary statistics and boxplots were obtained. The boxplots showed several outliers that will be removed before analysis of data. The boxplots showed median times, the middle time, that were similar in each trial. The Inner-Quartile Ranges were compared and were found to have differences in dispersion between the trials. The most compact trials, those will smaller variance, were the first and fifth positions. Results and Analysis We entered our data into StatCrunch software and performed a one-way ANOVA Test, which is used to compare the means of multiple data sets. Our data contained five outliers (indicated in the boxplot above). We ran an ANOVA with and without these outliers and the data can be seen in the tables to the right. Since the consequences for making a type 1 error are not very significant, we chose a level of significance of .05 to compare our P-values to. The P-Value (.1638) for the data with the outliers signified that there is no difference in finishing times for positions 1-5. However the P-Value (.0483) for the data set with outliers removed showed that at least one mean was different from the others We constructed a means plot (bottom right), which shows the confidence intervals for each of the sample means, of our data with the outliers removed to see which of the data set(s) were different. The means plot indicates that Position 5 is faster than position 4. We can’t infer any other differences from the plot as all other positions contain overlap with one another. Sources Data was collected from the official Utah Barrel Racers Association’s website www.utbra.com Data was analyzed using StatCrunch Software www.statcrunch.com Methodology Our method for data collection involved randomly selecting four random competitions that have occurred since the beginning of the year 2013. For a given race, we organized the data into groups of 5 consecutive runners (i.e. 1-5, 6-10, etc.) We randomly selected 45 of these groupings from the 4 different races. We used a random number generator in order to randomly select these 45 groupings. These groups of 5 were then broken down and separated into 5 groups based upon running order (ie. Group 1 is all riders who rode first in their group, etc.). All outliers will be removed and hit barrels times will be adjusted Barrel Racing TimesDarion Bevan, Darcy Mines, Brent Johnson Math 2040 Statistics for Applied Science