Enzyme Catalysis Lab: Optimizing Peroxidase Reaction Conditions
270 likes | 334 Vues
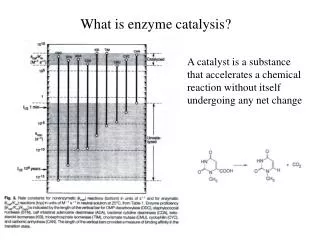
Explore enzyme function, optimal conditions, and catalytic cycle using peroxidase in chemical reactions. Conduct experiments at varying temperatures and pH levels. Use a spectrophotometer to monitor reaction progress and analyze data to determine optimal reaction conditions.

Enzyme Catalysis Lab: Optimizing Peroxidase Reaction Conditions
E N D
Presentation Transcript
Purpose of the lab exercises: • Review the function and characteristics of enzymes • Become familiar with the spectrophotometer • Determine the optimal reaction conditions for the enzyme peroxidase
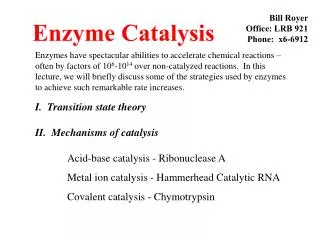
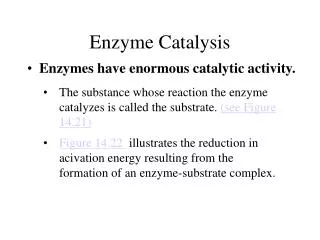
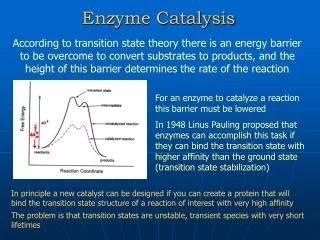
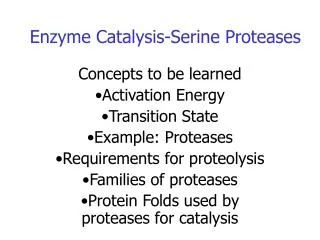
Chemical Reactions • Involves breaking and making bonds • Requires an exchange of energy between the molecules and the environment The energy required to start a reaction: ACTIVATION ENERGY(EA) • Energy required to break the chemical bonds in the reactants
Enzymes: Activation Energy Enzymes: • Decrease the activation energy of a reaction Activation Energy: • Energy required to break bonds in reactants • Lowering activation energy speeds up reaction
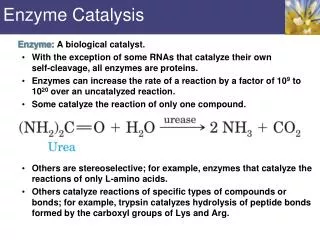
Enzymes: Optimal Conditions e.g.: Heat-tolerant bacteria enzymes optimally function at higher temperatures than most enzymes in humans Each enzyme has an optimal set of conditions at which the maximum reaction rate occurs Enzymatic reactions are affected by: • Temperature • pH • Enzyme conc. • Substrate conc.
Chemical Reactions & Enzymes • BUT, these things cannot be done in a cell • The, internal and external environment of a cell is relatively constant So, how does a cell proceed with reactions? Enzymes!! • Catalytic proteins • Change the rate of a chemical reaction • Not consumed by the reaction
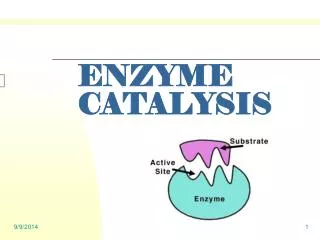
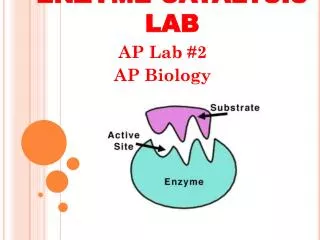
How Enzymes Works The substrate (reactant) moves toward the enzyme’s active site The chemical reaction is triggered by the enzyme The enzyme releases the product
Enzymes • Are very specific for their substrate
Enzymes: Peroxidase Today’s lab: Determine optimalconditions for the enzyme peroxidase HOW? Carrying out 4 separate experiments varying: • TEMPERATURE • pH Substrate used in experiments: Mixture of guaiacol (resin from a small tree) + hydrogen peroxide
Peroxidase OH O OH OH H3CO H3CO H3CO OCH3 Peroxidase Guaiacol Radical (unstable) + 2 H2O 2,2’ dihydroxy-3,3’ dimethoxybiphenyl (colorless) (Yellow) + H2O2 O H3CO OCH3 O (Red) 3,3’-dimethyoxybipheno-4,4’ quinone • Catalyzes oxidation of guaiacol Transfers hydrogen and electrons from guaiacol to hydrogen peroxide • Color change (substrate is yellow and product is red) • Monitor progress using a spectrophotometer
Spectrophotometer • Measures the amount of light passing through a solution at a specific wavelength • Determines how much light was absorbed by a solution
Spectrophotometer In today’s experiments, as the reaction progresses: • More and more reddish product forms • Absorbance readings will increase
Enzyme Experiments Experiment 1 (Temperature) Experiment 2 (pH) • Four students (two pairs) in each row should work together • One pair does Experiments 1 (temperature) • The other pair does Experiments 2 (pH)
Lab Summary Need a graph of A500 as a function of time for the temperature experiment Steps: • Mark the temperature for each of the four curves in a legend to the graph • Calculate from the initial region (straight line portion) of each curve the rate of the reaction at each temperature (A500 per second) and enter these values next to each curve
Lab Summary “Graphing” Mark the temperature clearly for each of the four curves or in a legend to the graph
Lab Summary “Graphing” Calculate rate from the initial region (straight line portion) of each curve at each temperature (A500 per second) and enter these values next to each curve 0.002 A500/sec
Lab Summary “Graphing” The rate of the reaction is linear for about 20 seconds, (straight-line portion” of the reaction) After ~ 20 seconds: There are not enough substrate molecules So the rate slows down Calculate the rate of reaction using only the straight-line portionof the reaction data
Lab Summary “Calculating Rate” Rise Rate = Run 0.035A500 Rate = 15 sec Y2 - Y1 = =0.002 A500/sec X2 - X1 Rise 0.035A500 Run 15 sec
Lab Summary In a similar way, the rate of reaction needs to be calculated for 25oC, 35oC, 45oC and 55oC Temp oC Rate, A500/sec 25 0.0002 35 0.0020 45 0.0015 55 0.0010 • On a separate set of coordinate axes, make a second graph relating reaction rate to temperature • Label the optimal temperature (the temperature at which the enzyme exhibits its highest rate of activity)
Lab Summary “Graphing” The optimal temperature is 35OC Temp oC Rate, A500/sec 25 0.0002 35 0.0020 45 0.0015 55 0.0010
Lab Summary “Conclusion” At 25oC • Molecules are moving more slowly • Substrate collides less frequently with enzyme • Slower rate of reaction • At 45 & 550C The enzyme becomes “denatured” • The enzyme no longer functions properly
500 60 sec
Lab Summary Similar analysis of data for the pH experiments should be done
filter Make sure level set to 340-599nm • Start with 0 transmittance • Change from transmittance (0) to absorbance on mode (19999) • Set wavelength to 500 nm • For blank set absorbance to 0