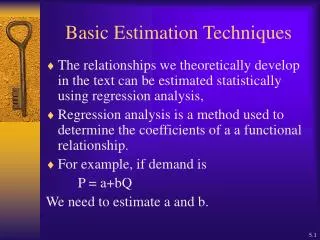
Flash Estimation and Variable Selection Techniques: Raiders of the Lost Arch Model
Delve into the complexities of flash estimation methodology employed by Eurostat and Member States for IPI, GDP, and LCI. Explore variable selection challenges and techniques, including the HCA method. Understand the importance of incorporating hard data in FE models for reliable nowcasts.


Flash Estimation and Variable Selection Techniques: Raiders of the Lost Arch Model
E N D
Presentation Transcript
Flash Estimation and Variable Selection Techniques “Raiders of the Lost Arch Model”
Foreword: The Flash Estimation Network • In 2006, Eurostat launched a call for proposal for the production of reliable flash estimates for IPI (t+30), GDP (t+30) and LCI (t+45). • Joint answer from 4 NSI’s accepted by Eurostat: France, Germany, Italy and United-Kingdom • Objectives: Check the feasibility and propose methodolog(ies)y for Eurostat and Member States • A 2-year project: • First year, preparatory work: survey to check for existing experiences, databases, bibliography, methodologies; • Second year, run simulations, propose methods and estimates, prepare programs and transfer of knowledge • Here, we focus on the methodology
Foreword • Lots of papers on the same subject. • What is really different? The methodology used • No formula in this presentation but quite technical: lots of statistical techniques are mixed in this strategy to look for a model « Any sufficiently advanced technology is undistinguishable from magic » Arthur C. Clarke, Profiles to the Future, 1961
Outline • What is a “flash estimate”? • What is a “good” model? • The variable selection problem • Variable selection techniques • Where should I dig? A method based on HCA • An example: nowcasting the Eurozone GDP • Data and process • Comparing “usual” and HCA results • Conclusions
What is a “flash estimate”? • Very difficult and sensitive question • Lots of discussions (not to say arguments) • Why? Soft and hard data • An agreement • Pure AR models (no new information) can be used as benchmarks but are not accepted for FE • Still a disagreement • Can a model be based on soft data (BCS) only? • A compromise • FE models must incorporate hard data (as much as possible). Much easier for quarterly data.
What is a “good” model? • Reminder: the model will be used in production! • Main characteristics • Simple (few variables) • Interpretable • Good “statistical properties” including robustness • And last (and least) good nowcasts • Other considerations • Stay close to the user database as much as possible in order to minimize “interactions” during the production process. • Provide the user with a “built-in” but flexible methodology (and program) based on his/her tools.
The variable selection problem • Example: nowcasting the EA GDP • Potential explanatory variables: • IPI, New orders, Energy prices, HICP, Unemployment, Business surveys (Industry, Retail trade, Construction, Services) etc. Easy to find at least 20 variables (monthly and/or quarterly) • 13 countries + EA, 2 lags? • It comes to 20*(13+1)*3=840 potential variables • More than 20 billions possible models with 4 explanatory variables!!!!
Variable selection methods • You must (Do you?) reduce the set of explanatory variables • Trial and Error approach DOES NOT work • NIESR approach (J. Mitchell) • Drastically restrict the set (Expert knowledge) and then evaluate all possible models • GETS (General to specific) approach • Start from an overparametrized model and use statistical tests to reduce it • Dynamic Factor Analysis approach • Summarize the set of variables with uncorrelated factors and use some of them in the model • Cluster Analysis approach
Step 0: Selecting a batch of explanatory variables • Here, we take all the information present in the Euro-Indicator database. • But with some a priori selection • If the Y-variable is SA, we will use SA indicators • You may (or not) exclude some variables (small countries, not reliable series etc.) • Or better, flag them using some a priori knowledge, example: • 0 : I would exclude it • 1 : I do not know, • 2 : could be interesting, • 3 : I would appreciate to see it in a model
Step 1: The dependant variable • Checking the main characteristics of the dependant variable • seasonality, trading-day effect, outliers etc. • Size of the irregular, revision analysis • what can we really expect in terms of precision?
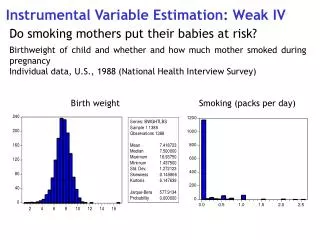
The Y-variable : Euro-area GDP • Quarterly growth rate of the SA series (EA CLV) • Irregular SD: 0.142
Step 2: Preparing the data • Y-variable • Checking for log-transformation • Removing outliers: they will be “re-incorporated” at the end of the flash-estimate process • Removing seasonality if present (annual growth rate) or modeling it • X-variables • Checking for log-transformation and differencing (with Tramo) • Removing seasonality, outliers and TD effects: Seasonal and TD dynamics may be different between variables • Forecasting missing months when nowcasting a quarterly Y-variable
Looking for X-variables • Example • We want to flash-estimate 2007Q4 at 30 days. • Checking date 30/01/2008 • Variables from Euro-Indicators • Monthly and Quarterly variables; • 668 Monthly; 162 Quarterly (B1GM_UK) • For monthly variables, we know at least 1 or 2 months of the quarter to “nowcast” • Cleaning and “forecasting” of X-variables
Step 3: First selection with Cluster analysis • Variable selection • Cluster analysis: clusters of “similar X-variables” (various clustering criteria available) • Selecting a few variables (Medoids and/or Dynamic factors) in each cluster using Hsiao-Granger causality test, coherence between growth-rates, correlation • Example: 6 clusters, 2 variables per cluster, 2 lags 36 potential variables 60,000 models with 4 explanatory variables
Step 4: First selection of models • Looking for the n “best models” using usual OLS regression analysis • Several possible criteria: • R-square, Mallow’s Cp, Adjusted R-square etc. • First statistical evaluation of the models but still “no dynamics” • Possible second selection of the model using “economic” criteria or expert knowledge (which models are “relevant”?)
Step 5: Statistical evaluation of the models • In-depth statistical evaluation of the model using PROC AUTOREG (autoregressive error) • Statistical criteria: • R-square, AIC, BIC, Reset tests, Chow tests, Durbin-Watson tests, Arch tests, Stationarity tests, Godfrey tests etc. • Coherence between growth rate signs • One-step and 2-step ahead forecasting error • Dynamic evaluation of the models using the real-time database
Step 6: Choosing the model(s) • The choice is now based on statistical criteria and “expert knowledge”: • Does the model have good statistical properties? • Is the model simple and robust enough? • Is the model “relevant” from the Economic point of view? USUALLY NOT !!! • But …… could be improved changing a variable for another one, more “relevant” (“flagged” variables) from the same cluster.
Improving the models • Third model: IO_PL, IP_EA13, UE_NL • IO_PL belongs to the same cluster than T_EXP_EA13 • UE_NL close to UN_FR or UN_EA13 • And we have a new model • T_EXP_EA13, IP_EA13, UN_EA13 • RMSE=0.15543
Comparing with « traditional » approach • We estimate 9 different models • Model1: IP, CPI, RET, CARS • Model2: GDP-1, SentInd • Model3: qsind, qsserv • Model4: qsind, qsret, qsconst • Model5: share-1, compe12-2, spread • Model6: GDP-1, cli • Model7: IP, CPI, RET • Model8: GDP-1, cli, CARS • Model9: qsind, qsret, qsserv, qsconst