Detector Efficiency
Detector Efficiency. IRAD 2371 Week 3. Efficiency. Very few detectors will count every interaction Each detector will have its own counting efficiency Eff =CPM/DPM Can use efficiency and count rate to determine amount of material present

Detector Efficiency
E N D
Presentation Transcript
Detector Efficiency IRAD 2371 Week 3
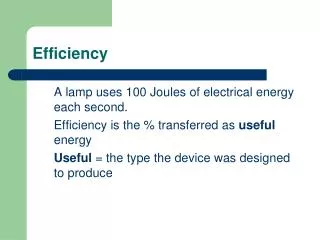
Efficiency • Very few detectors will count every interaction • Each detector will have its own counting efficiency • Eff=CPM/DPM • Can use efficiency and count rate to determine amount of material present • Amount of light produced per energy deposited in crystal
Efficiency • Relative efficiency- amount of response from the detector from radiation that has entered the detector volume • Absolute Efficiency- amount of response of the detector from the radiation that is emitted from the source
Efficiency • What the instrument reads divided by the how much radiation is being emitted • Will be affected by • Type of radiation • Energy of radiation • Geometry of source-detector • Shape of detector
Type • Alpha- any detector that has a barrier between the sample and active volume alphas may not have enough energy to penetrate • Beta- see above, energy of beta will determine the probability to penetrate barrier, will change eff from low to high as energy increases
Types • Gamma- • thin barrier no problem for gammas, lower energies may be better to interact with detector better than high energy gammas • Al/metal/plastic protective coverings on some scintillators will block low energy gammas and their eff will be very low • High energy gammas have low probability of interacting so eff will be low
Energy • Low energies- hard time penetrating into detector • High energies- easier to penetrate into detector • but have lower probability to interact for gammas • Once charged particle get into detector they have high intrinstic (relative) eff
Shape • Right circular cylinder- • most popular shape • Easy to manufacture • Easy to couple to PMT • Well counters- • Increased efficiency • Flat thin • Used to changed particle detection
Geometry • How is the sample oriented to the detector • Straight in front • Off to side • How far away • What is the make up of the sample • Solid • Density • Layers • Liquid • Layers • Settling
Sample geometry • Density of sample will determine eff of detector • Lower density higher eff • Higher density lower eff • Location • Directly in front of detectors is best • Off to the side decreases eff (not bad if you know how much) • If sample is farther from detector will decrease eff
Sample make up • Soil • Water • Homogeneous • Heterogeneous
Standard vs Sample • Standard you use to calibrate detector must be as close to the radionuclide that you are searching for • Standard must simulate the sample • Density, etc • Static vs Scan efficiencies • Static -detector is in single point for entire count time • Scan -detector is moving across the surface
Release limits • Most release limits are stated in activity per area • dpm/ 100 cm 2 • Need to find out if your instrument can detect down to this level • If your instrument can not detect to at least 10% below the release limit you can not use it for that purpose
Counting Statistics • MDA • LLD • SD • Count times
MDA • Minimum Detectable Activity- smallest activity that can be quantified • MDA= (2.71) + 4.64(Rb/T)1/2 --------------------------------------------- E (A/100 cm2) T= time of background and sample Rb=background count rate E= efficiency of detector A=effective area of detector
MDA • Background rate =50 cpm • Time =1 minute • Eff= 15 % • Area of probe= 25 square cm • MDA= ?
LLD • Lower Limit of Detection- smallest activity that can be detected • LLD= 1.64 (Rb/Tb)1/2 • ------------------------------------------------------------------------------------------- • E (A/100cm2) • Rb = background count rate • Tb = background time • E= efficiency of detector • A= effective area of detector
LLD • Background rate = 50 cpm • Time =1 minute • Eff= 15 % • Area of probe= 25 square cm • LLD= ?
Standard Deviation • Standard Deviation- measures the average difference from all number from the average of those numbers • SD= √(Σ(ni-nave)2/(N-1)) • ni = number in list • nave= average of number • N = number of numbers in list
Standard Deviation • Standard Deviation measures the dispersion of information. If the SD is low, the data points are close to the mean. If the SD is high, the data is spread out. • Normal distribution is when • there is an even distribution • around the mean. • Like here:
Standard Deviation • With a normal distribution (gaussian distribution) • When the SD is low the variation is low and the curve is tall and peaky (all the data is close to the average) • When the SD is high the variation is high and the curve is low and flat (all the data is spread out and can be very different than the average)
Standard Deviation • Number of SDs • One SD on either side of the mean encompasses 34% of the graph • One SD on both sides of the graph encompasses 68% of the graph • 2 SD on both sides of the graph encompasses 95 % of the groph • 3 SD on both sides of the graph encompasses 99.8% of the graph
Detector Confidence • The number of SDs is used to designate the precision of a measurement • If one can say that their measurements are good to within 2 SDs they are saying that 95% of the time their reading will be correct • The higher the SD used the more precise your numbers will be
SD • SD of net count rate =√ Rt/Tt+ Rb/Tb SD of background count = √ Rb/Tb
SD • Background = 50 cpm • Background time= 10 minutes • Sample count rate = 500 cpm • Sample time = 5 minutes • SD =
Count times • Maximization of count times • Ts/Tt-s = √Rs/Rb • Or • Ts/Tb = √Rs/Rb
Max count times • Sample count rate = 800 cpm • Background count rate= 50 cpm • Sample count time= 5 min • Background count time= 10 min • If you had an hour to count both BG and sample, how long would you count the sample for?